Why bookmarks rot, and what to do about it
Everyone's bookmarks end up the same way: a bar full of favicons with no labels, folders you never open, and a long tail of links that quietly stopped working years ago. The problem is not storage. A bookmark collection is write-only: you add to it constantly, you search it almost never, and nothing in the system ever tells you a link has gone.
Hosted tools solve the organising part, but they ask for an account and a copy of your links on somebody else's server. That trade never sat right for something as personal, and as boring, as a list of URLs.
Then the homelab joined in. Once the dashboard knew your links and could tell when they broke, it made sense for it to know the containers behind them too. Eight things nextDash does that a bookmark bar does not:
Pages, categories
Unlimited pages holding categories that hold bookmarks. Jump with 1-9. A page can be shared as a template file.
Every keystroke
j/k move, Enter opens, a shortcut opens a site the moment you finish typing it.
Inbox & sources
Paste, extension, share sheet, or a source that brings links in for you.
Health & uptime
Per-bookmark checking, 30 days of history, drift detection and alerts with action buttons.
Containers & Unraid
Every container and your Unraid array, matched to the bookmarks for the same services.
Widgets
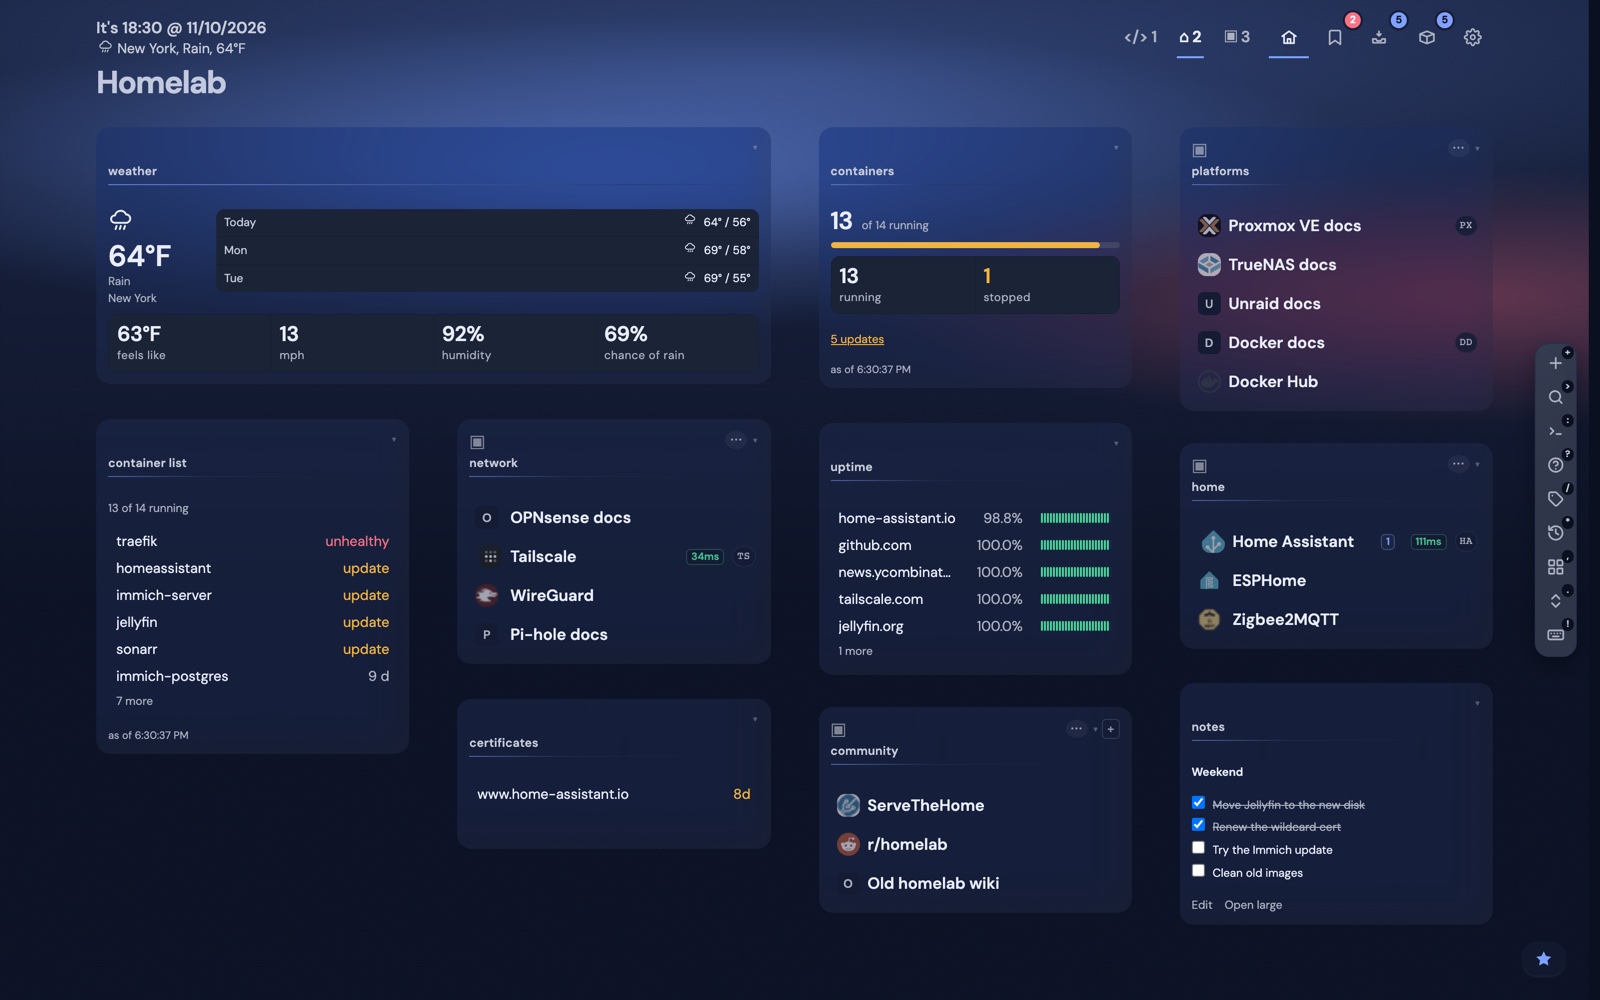
A block on a page can hold a health board, an uptime chart or a container list instead of links.
Look studio
Themes, backdrops, glass and glow, changing the real page as you go.
Plain files
JSON in a folder you chose. One ZIP holds your whole data directory.
Everything is a keystroke
More than 250 shortcuts across a dozen groups, but you need about ten of them to be faster than you were before. One rule holds the scheme together: every action on a bookmark is Shift plus a letter. Shift+E edits, Shift+V previews, Shift+L shares, Shift+S always opens config. Bare letters act on the first press. A short tour of seven steps shows the first ones (Shift+K plays it again), and a key legend under the grid keeps them in sight (Shift+Z hides it).
Three levels of structure, a handful of views
page          a tab across the top - "main", "work", "media". Keys 1-9.
 └─ category  a column heading - "vps", "tools", "reading". Collapsible, sortable.
     └─ bookmark   a row - name, URL, favicon, shortcut, tags, note, health status.
└─ widget a block among the categories, one or two columns wide.| View | How to get there | What it is for |
|---|---|---|
| Dashboard | Esc | The grid of categories, bookmarks and widgets. Your start page. |
| Bookmarks | Shift+H · Shift+U | The whole library with health built in. Shift+H opens it on the broken ones, Shift+U on Unsorted. |
| Containers | Shift+Y | Every container on the host, grouped by compose project, matched to its bookmark. |
| Inbox | Shift+I | The holding area for links you saved before deciding where they belong. |
| Theme Studio | Shift+A | Themes, looks and backdrops, changing the real page as you go. |
| Config | Shift+S · < | Every setting, each section deep-linkable. |
The first ten keys
| Key | What it does |
|---|---|
| j k ← → | Move the highlight around the grid. |
| Enter | Open the highlighted bookmark. Ctrl/Cmd+Enter opens it in a new tab. |
| 1-9 | Switch page. Shift+Left/Right cycles, comma shows an overview with counts. |
| > | Search. Start typing; Enter opens the top result. |
| : | Command palette - collapsible groups, recent commands at the top. |
| & | Quick add. Type name | url | shortcut on one line and it is saved. |
| Ctrl+V | Paste a URL anywhere on the dashboard - a card shows what it is, then it pre-fills the new-bookmark form or goes to the Inbox. |
| Shift+E | Inline-edit the highlighted bookmark. Ctrl+Enter saves, Esc cancels. |
| Shift+A | Open the Theme Studio. Shift+Y for Containers, Shift+H for Bookmarks. |
| ! / F1 | The searchable cheat sheet. Everything else is in there. |
| t | Open the tag view for the highlighted bookmark's tag. / opens the tag cloud. |
| Shift+Z | Show or hide the key legend under the grid. Shift+K plays the dashboard tour. |
Shortcuts that open sites
Give a bookmark a shortcut - GITHU, JELLY, TOWER - and typing it on the dashboard opens the site. No search box, no Enter. The project's own note: "a shortcut that needs Enter to finish is not much of a shortcut." Collisions are real, so there are three modes under Config -> Behavior -> Search: open instantly (the default), open after a short pause, or require Enter.
Six ways to search, one bar
| Key | Mode | What it searches |
|---|---|---|
| > | Search | This page. Recent queries and saved searches appear as chips. |
| / | Fuzzy search | Ranked prefix, word boundary, substring. Also matches URL domain, tags and note text. |
| @ | Global search | Every page at once; each result shows which page it lives on. |
| : | Command palette | Bookmarks, navigation, look & layout, smart collections, settings & tools - and Docker actions. |
| ? | Finders | Your own web searches - "?g rate limiting" searches Google. |
| * | Recent | The bookmarks you opened most recently. |
Filters are typed straight into the bar, with autocomplete after each prefix. A leading minus excludes instead of selects, so "tag:dev -status:pinned" means dev links I have not pinned. Your browser's address bar is a search box too: type the keyword, Tab, a term, Enter, and you land in your bookmarks with the results on screen.
> Try it: > to search, : for commands, ! for the cheat sheet. open the demo ↗
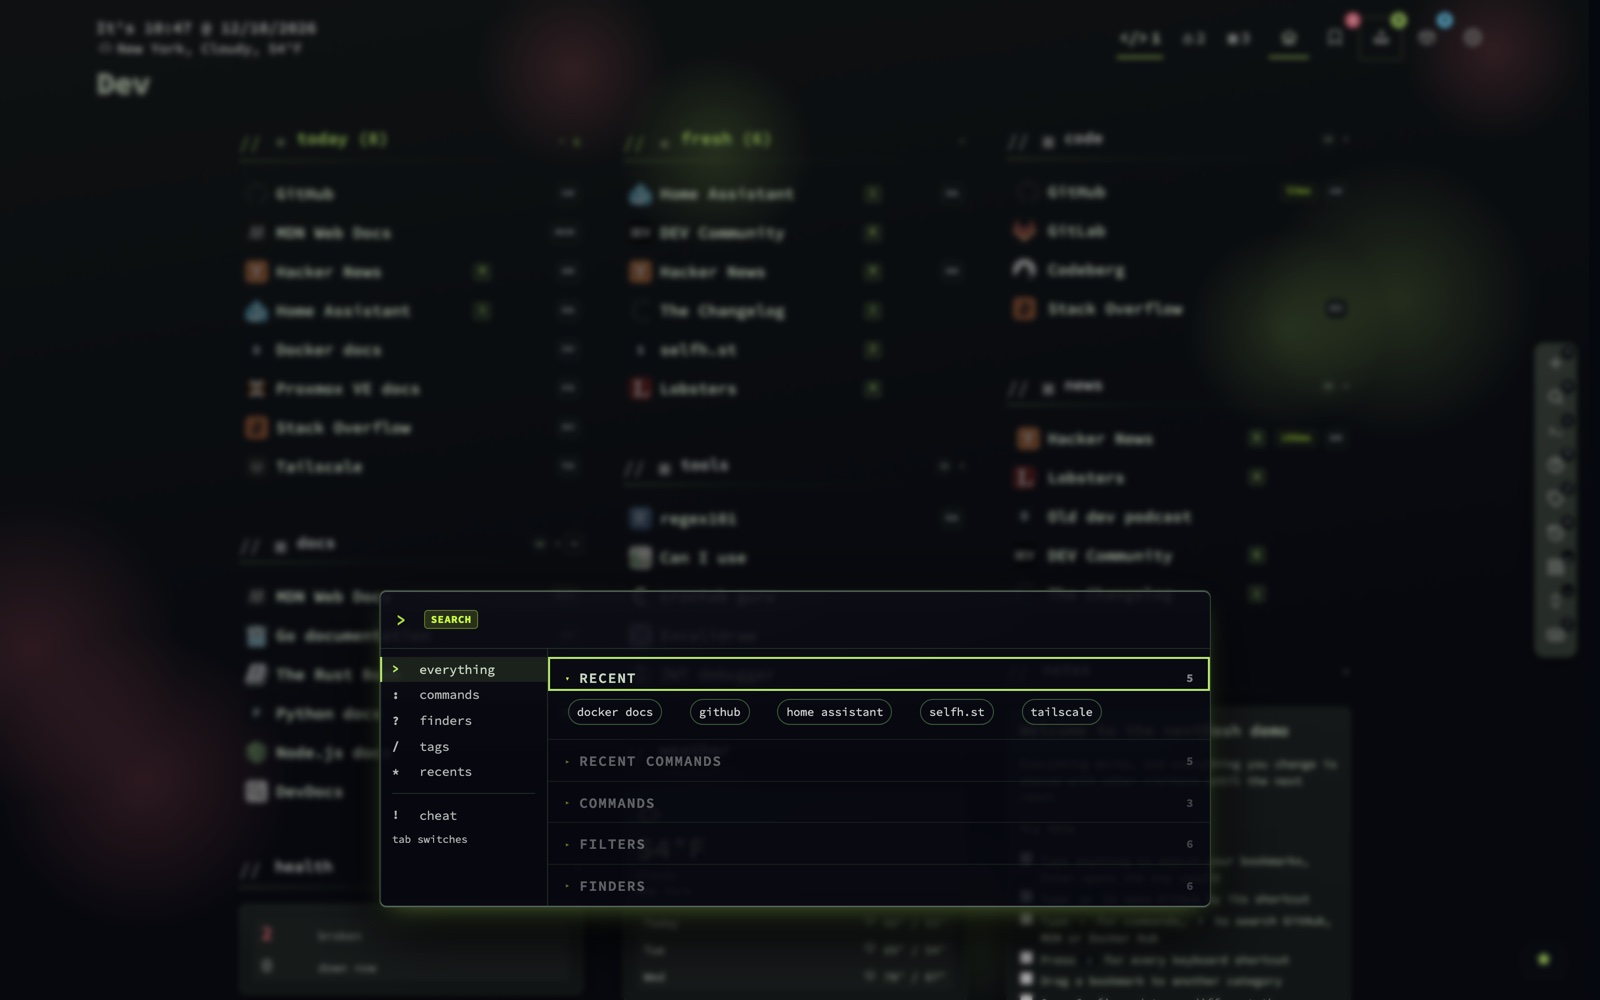
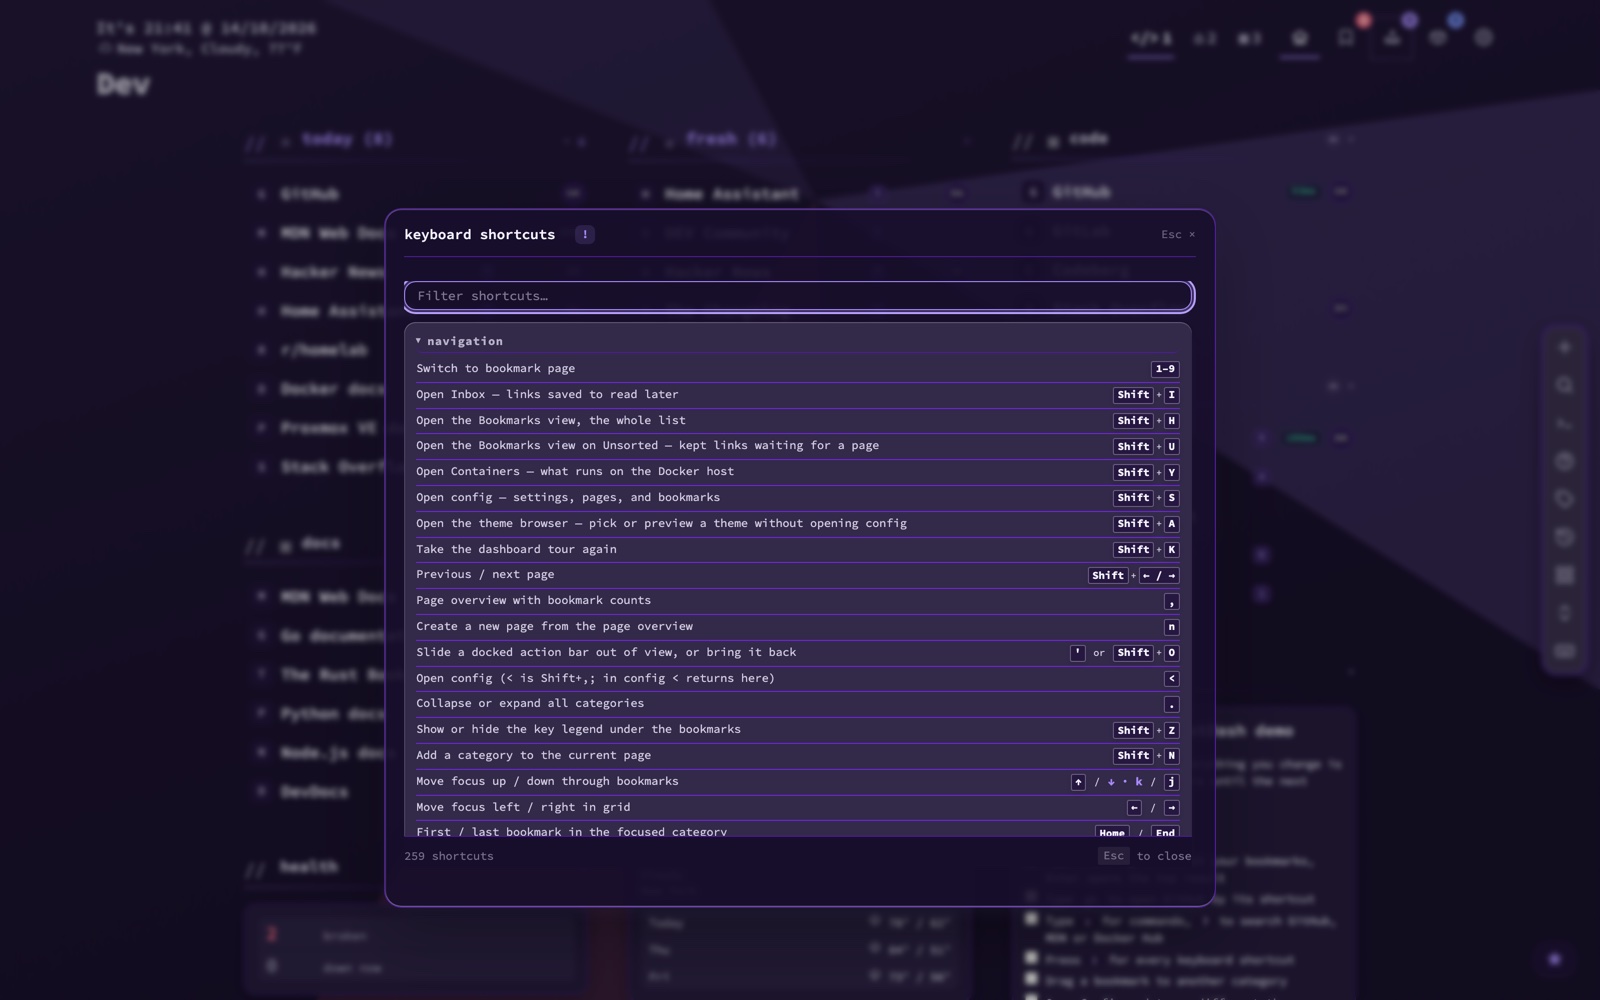
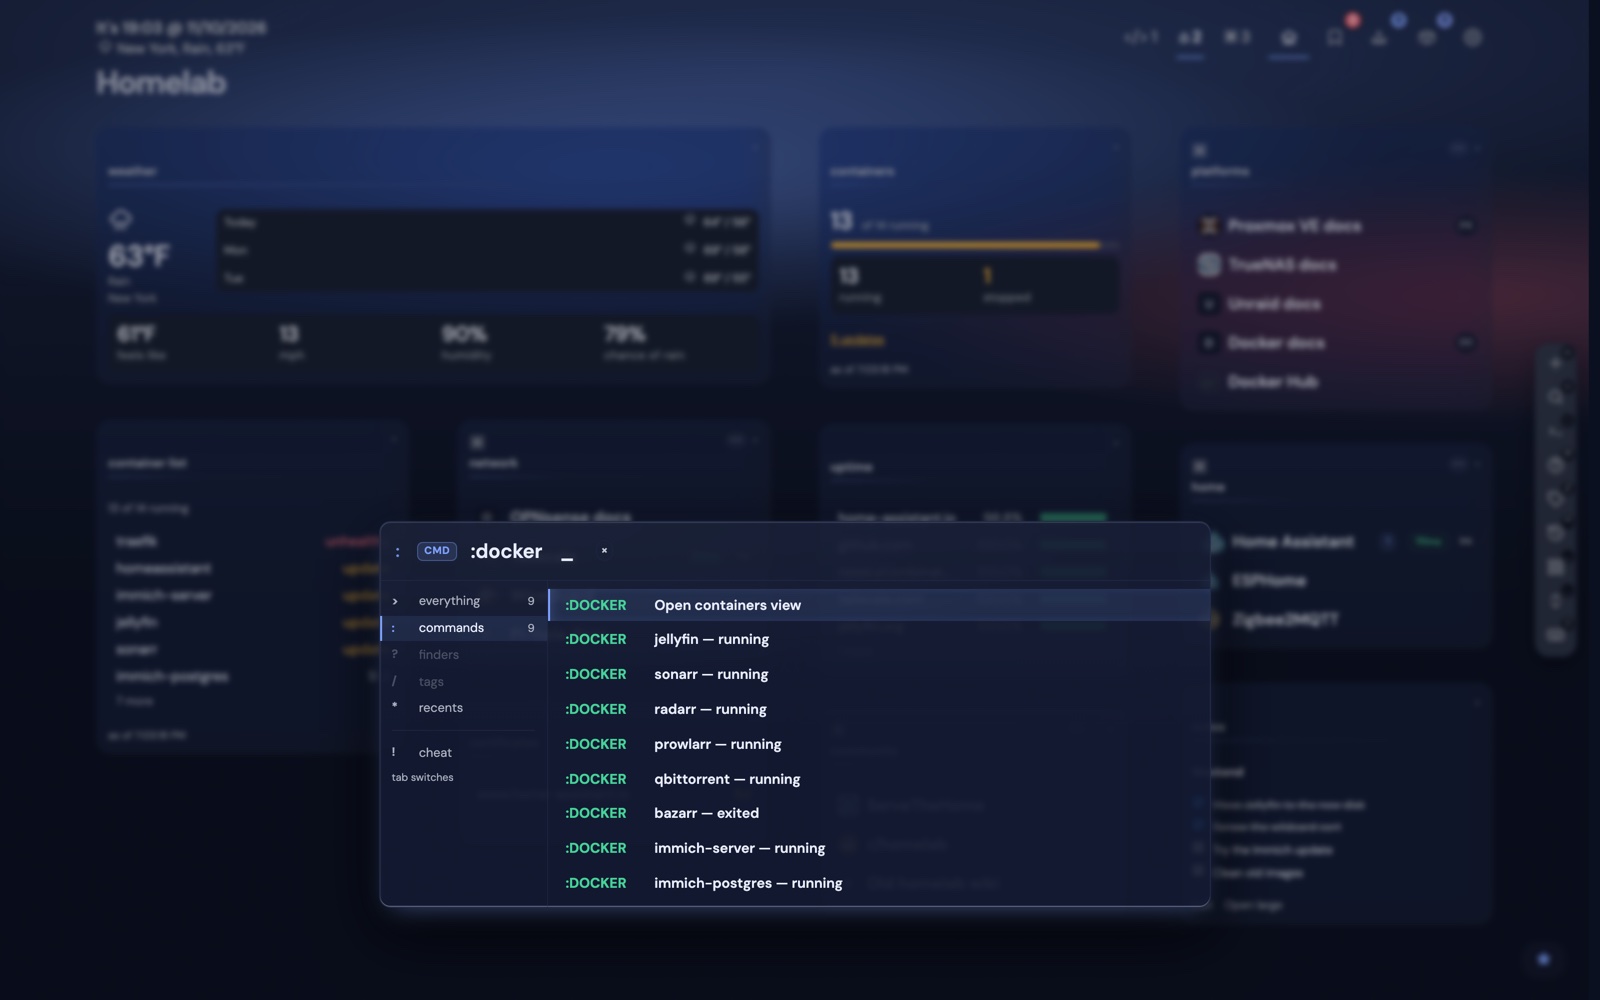
While search, the cheat sheet, quick-add or an inline edit is open, keyboard focus stays inside that overlay and the grid behind it is inert, not merely dimmed. That is the difference between a keyboard UI and a mouse UI with hotkeys bolted on.
Links in: by hand, and on their own
Saving a link should take almost no effort, or you will not do it. There are six ways to add links by hand, sources that bring links in on their own, and an inbox for everything that has not found its place yet.
Quick add & paste
& takes name | url | shortcut. Ctrl+V pastes a URL anywhere on the grid.
Browser extension
Pick page, category, tags and note - or save with your last-used defaults.
Bookmarklet
Built for you under Config -> Help -> Inbox, token filled in. Works in Safari, Firefox and mobile browsers.
Share sheet
Install nextDash as an app and it appears in your phone's share sheet. An Apple Shortcut covers iOS Safari.
Raycast, Alfred, Ulauncher
Type a URL, or save the front browser tab.
One shell line
./shell/nextdash-add "https://..." "A title", or GET /add?url=...&title=... directly.
The whole integration contract is one route
Every one of those tools talks to GET /add?url=...&title=.... A separate capture token opens capture and nothing else. In the project's own words: "anything that can open a URL or run curl is an integration."
Sources: links that arrive on their own
Config -> Data & backups -> Sources is for the places bookmarks keep arriving from, as opposed to the import buttons, which read a file once. A source remembers what it already brought in and previews what it would write before writing it. GitHub stars and Raindrop.io need a token; Hacker News, YouTube and Mastodon need nothing but a username or channel. A browser bookmark file imports too, and so do exports from Pocket, Pinboard, Raindrop, linkding, Shiori, Linkwarden and Karakeep, since they all use the same format.
Save something twice and nextDash asks instead of guessing. A URL already on the same page is refused; a copy on another page names the page and category it is already filed under and offers to open it, and "Save anyway" keeps the second copy.
Shift+J shows the focused bookmark as a QR code, so you can open it on your phone without typing the address, and Shift+L shares it.
The Inbox: triage, not a pile
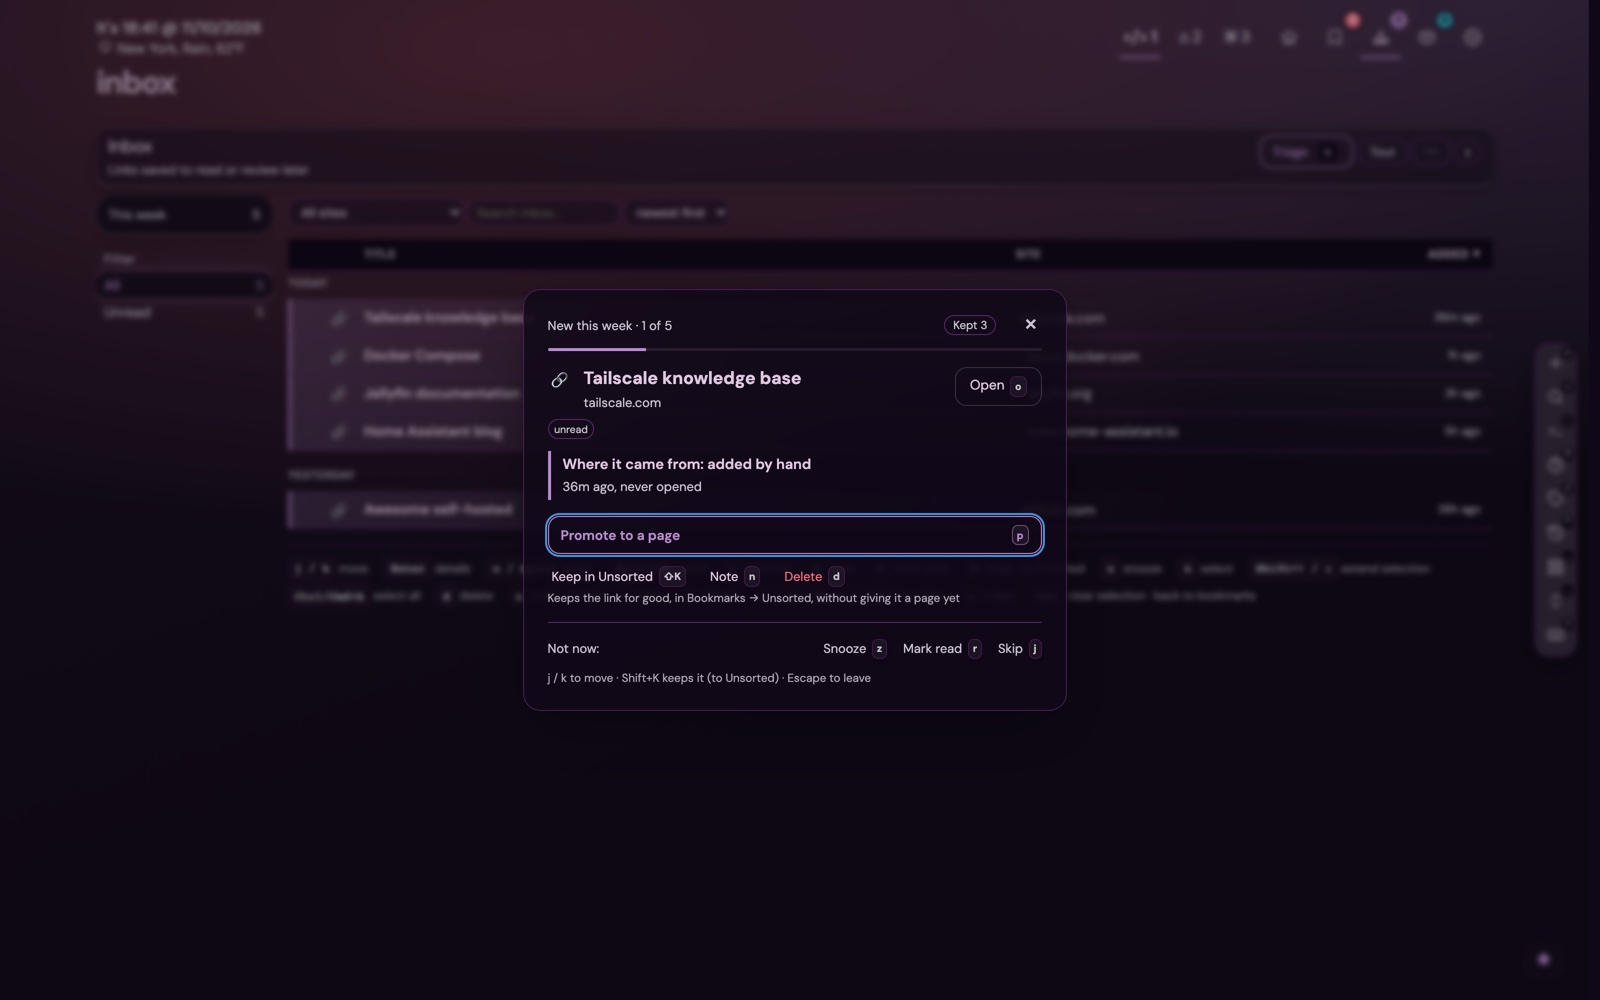
Shift+I opens the holding area for links worth keeping before you know where they belong. A rail of filters - All, Unread, Snoozed, With note - narrows it, and you can sort newest first (the default), oldest first, by title or by site. A Tags column shows each link's own tags, and a dashed chip offers one more: click to add it, the cross to turn it down, or Add all for the whole list.
Snooze z
Three hours, tomorrow, the weekend, next week, or a date of your own. Left out of every count until it wakes.
Promote p
Opens the full bookmark form pre-filled. The inbox entry disappears once the bookmark is saved - not before.
Keep Shift+K
Takes a link out of the queue for good, note and tags intact, and puts it on Bookmarks -> Unsorted. A toast confirms it, with Undo.
Triage t
One link at a time, pile by pile, each saying how long it has waited, with Promote as the clear next step.
> Try it: Shift+I open the demo ↗
Bookmarks: the whole library, with health built in
$ Statistics: see it in action →
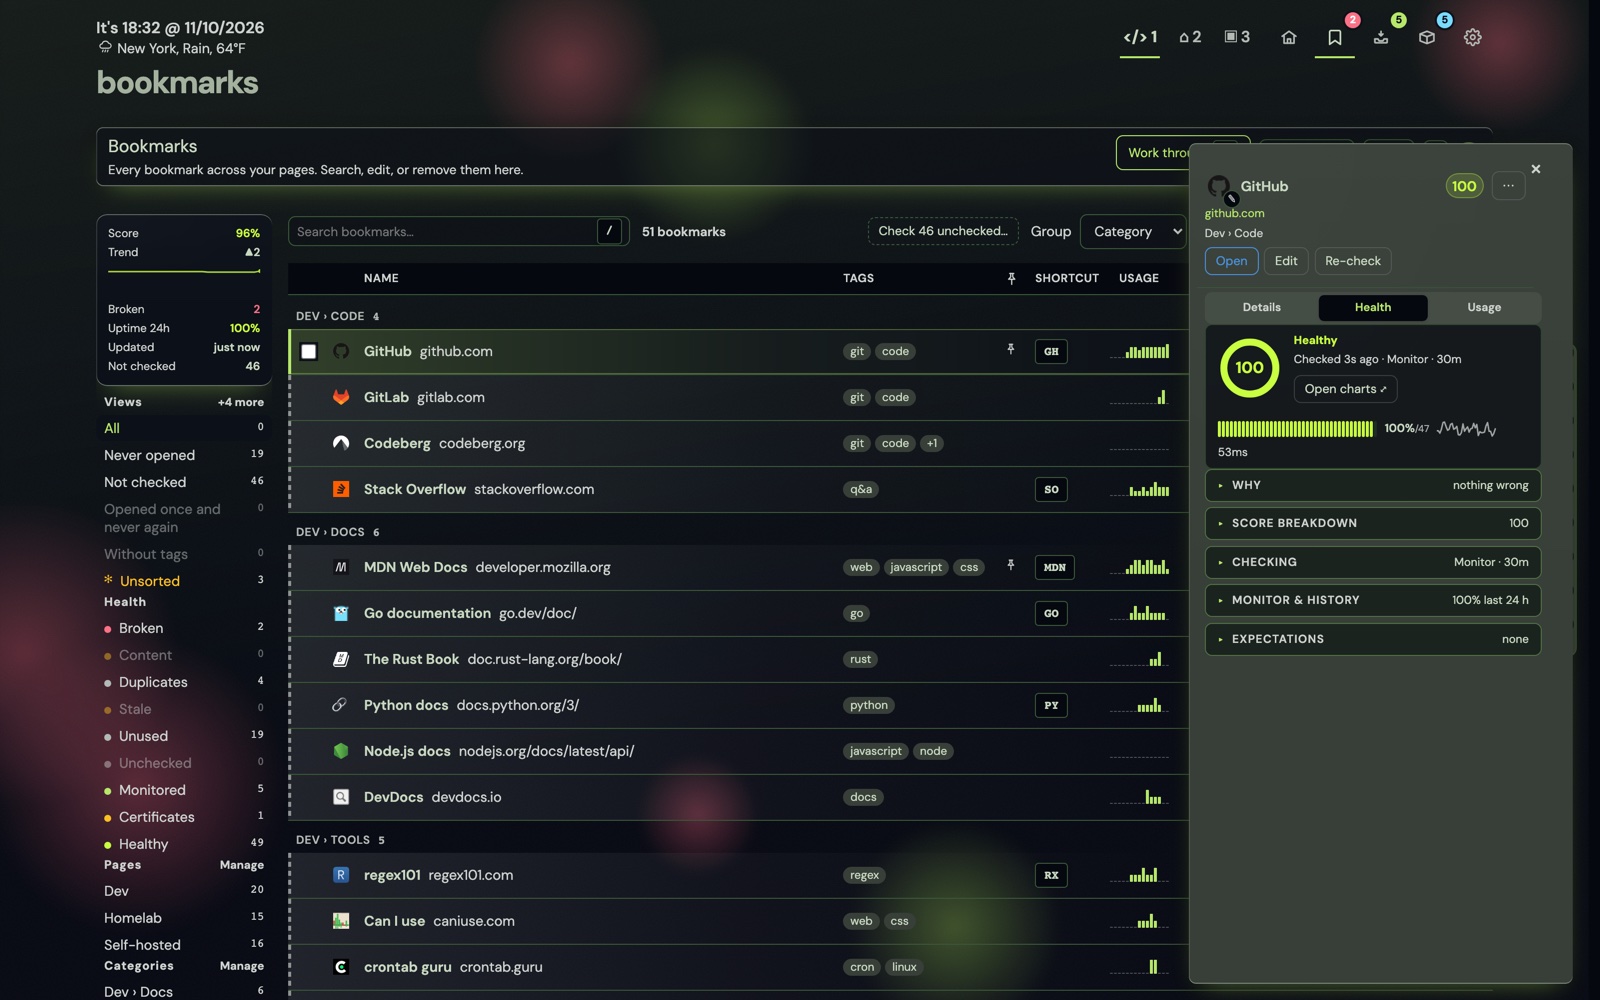
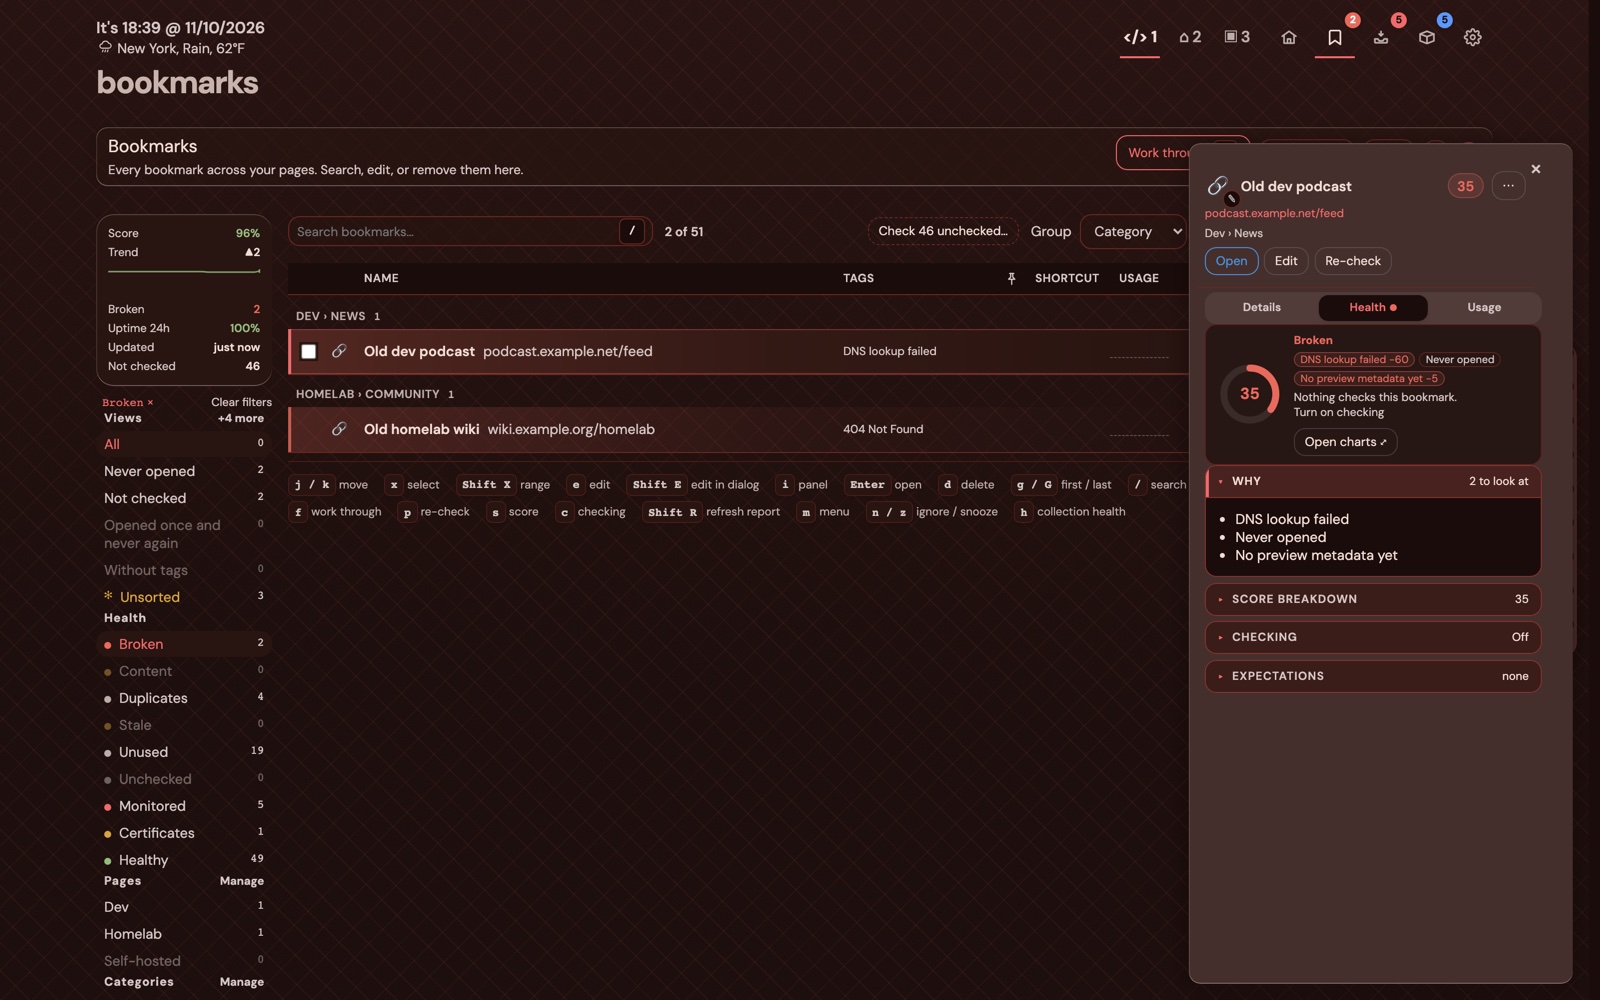
This is the part no other bookmark manager has, and the reason nextDash exists. One view for the whole collection: filters for broken, stale, unused and duplicated, a side panel with Details, Health and Usage, and Work through to clear a pile one link at a time.
> Try it: Shift+H or Shift+U open the demo ↗
Three levels of checking
| Mode | What it does |
|---|---|
| Off | Never checked. The right answer for most bookmarks. |
| Periodic | Checked in the background on the dashboard's own schedule. |
| Monitor | Checked on its own interval (5 minutes to 24 hours, default 15) with 30 days of history behind it. |
What it can detect
Reachability
Status and ping time, with named causes: DNS, timeout, refused, TLS, redirect or content.
Expectations
Text a page must contain, and which status codes count as healthy. A site that answers 200 while showing a database error is not up.
A bot check is not a dead link
Only answers that actually say the page or host no longer exists count as gone; a site asking "are you a robot" reads as unknown.
Drift
A page can answer 200 forever while stopping being the page you saved. Opt in and every check compares against a recorded baseline.
Certificates
Every monitored HTTPS check already completes a TLS handshake, so expiry costs nothing extra. Warnings at 30, 7 and 3 days.
Maintenance windows
Failures inside a scheduled window raise no alert and do not count against uptime.
A self-hosted service bookmarked at its web interface would answer "not signed in" to an anonymous check. Store a sign-in once under Config -> Data & backups -> Sources -> Health sign-ins and point any number of bookmarks at it. The secret stays out of your backups unless you ask for it, and is dropped if the service redirects the check elsewhere.
Uptime that does not flatter itself
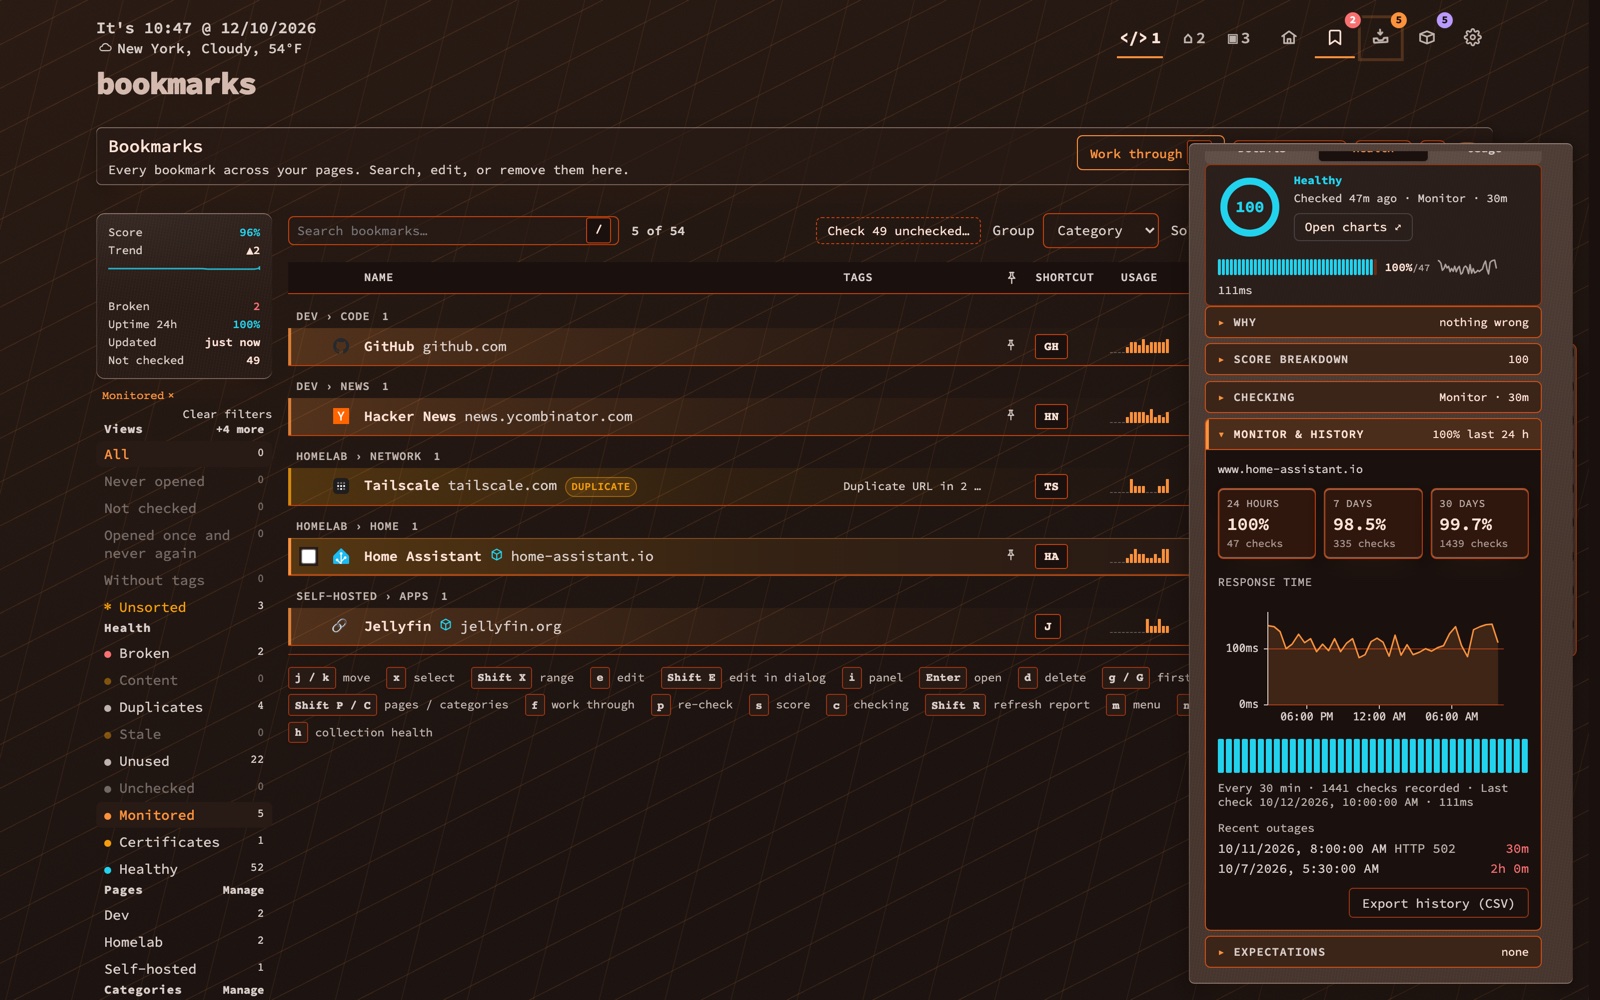
Uptime pools individual checks rather than averaging per-monitor percentages, and every percentage carries the number of checks behind it: 100% from three checks is a weaker claim than 100% from three hundred. Days you did not open the dashboard leave a gap rather than a straight line through them.
The whole collection at a glance
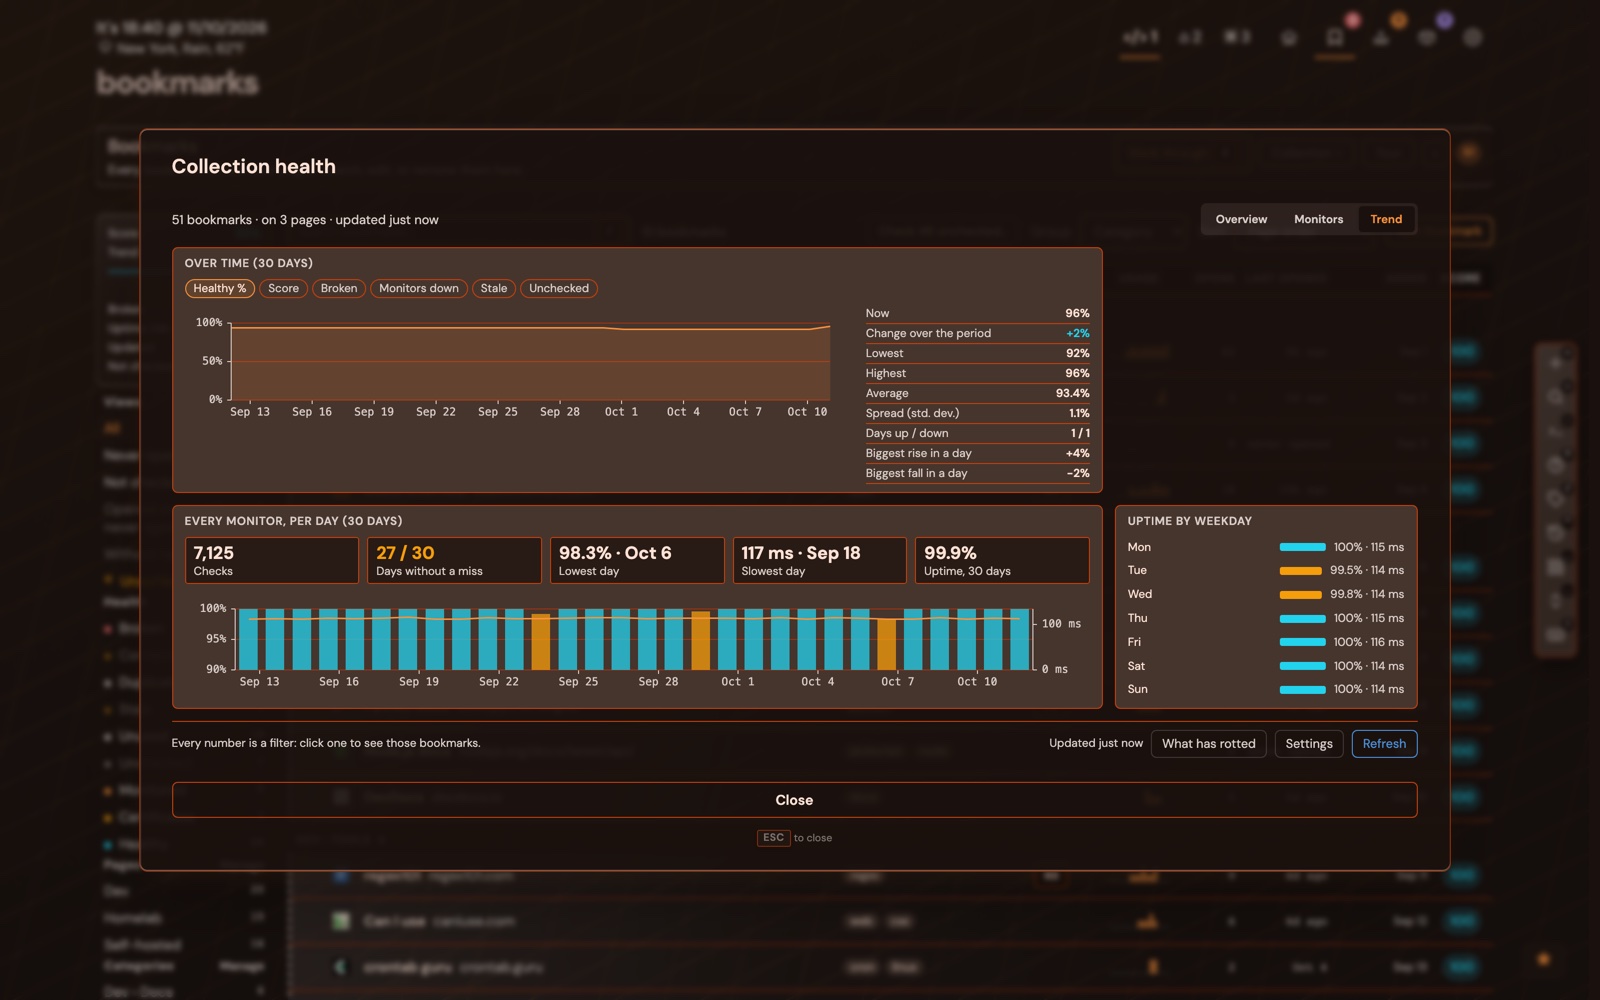
Collection health, reached with h from the Bookmarks view, is the wider picture: the score over time, what is wrong and of what kind, health per page, checking coverage, monitor uptime with the least reliable bookmark named, and certificates running out. Every number on it opens the matching filter. It has three tabs: Overview, Monitors (uptime per monitor, the least available and the outages as a 30-day lane each) and Trend (90 days, every monitor per day and uptime by weekday).
Getting told, and working the list
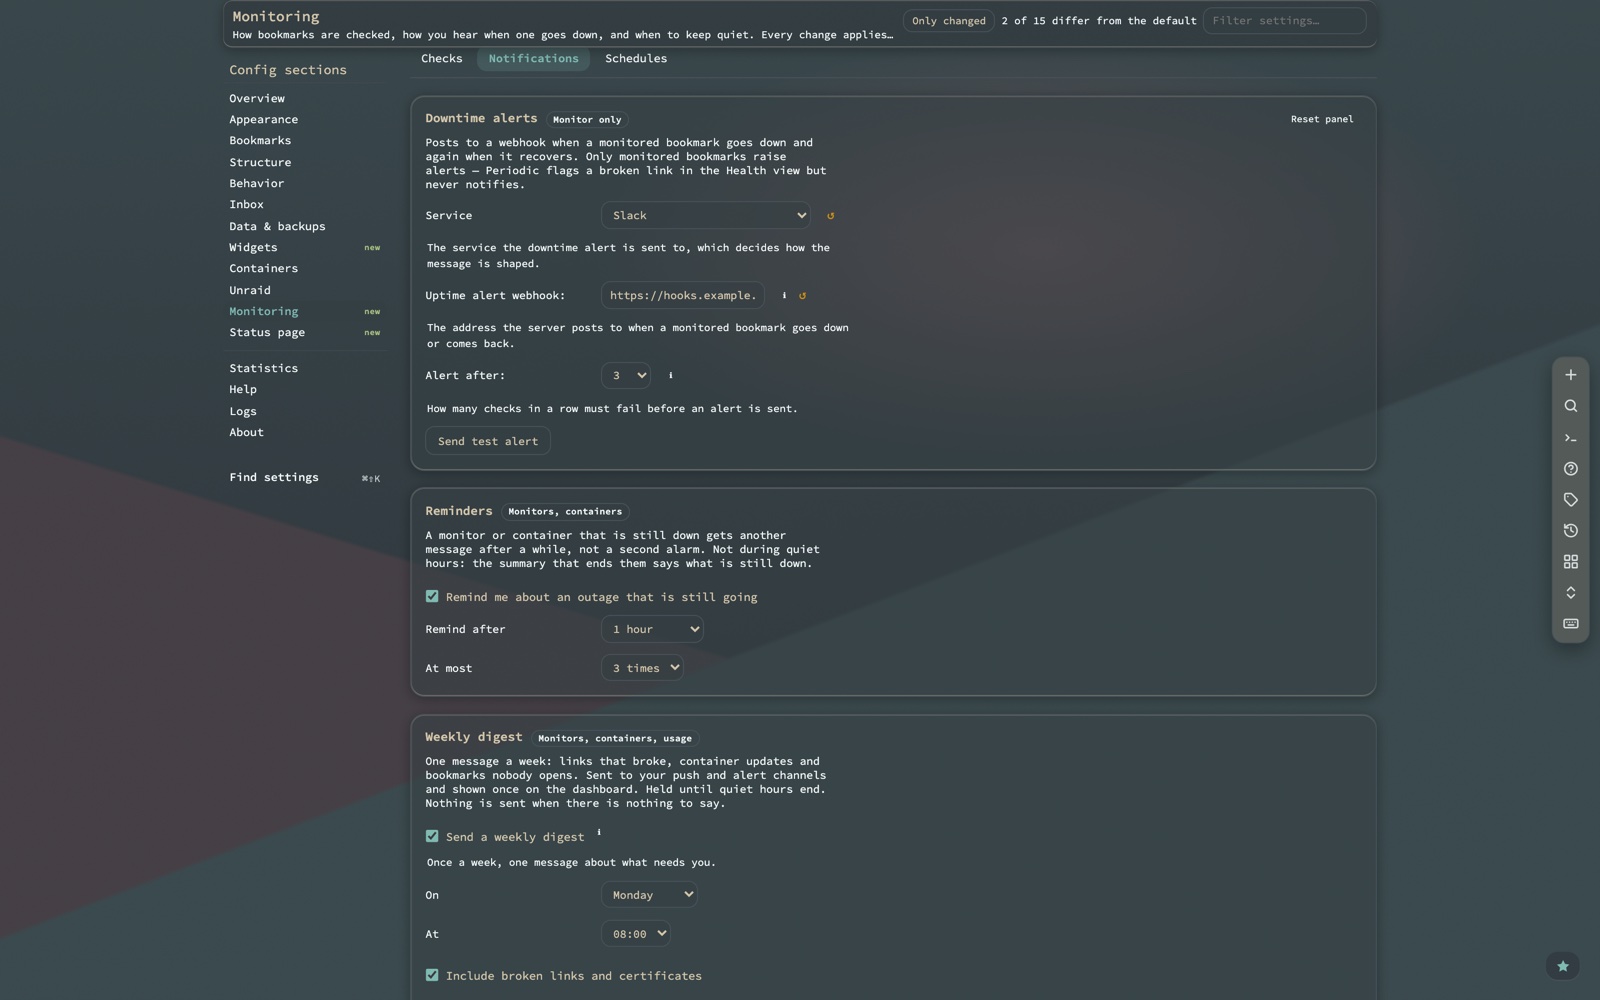
A downtime alert fires after a number of consecutive failures (default 3) and again on recovery. A container that stops or an Unraid disk that drops out reaches you through the same channels.
- An alert through ntfy carries Open link and Health buttons, so you can act on it without finding a laptop.
- Apprise reaches mail, Matrix, Signal and a hundred more. Everything about checking and telling lives in one section, Config -> Monitoring, with tabs for Checks, Notifications and Schedules (maintenance windows and quiet hours).
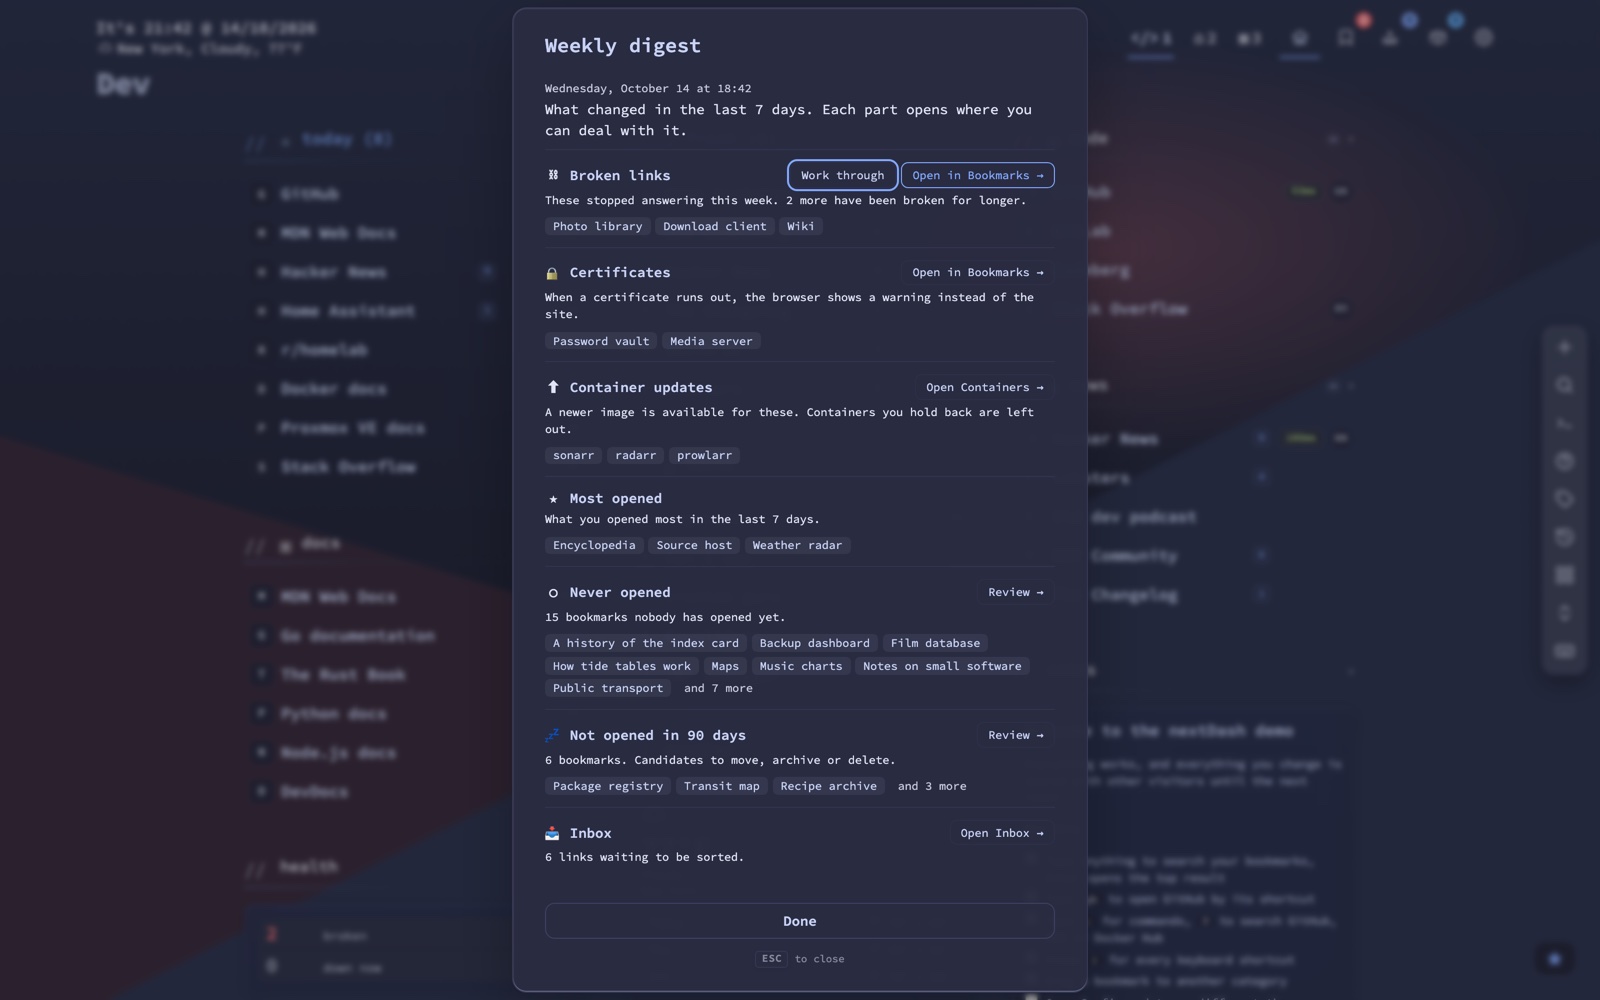
- A weekly digest sums up what needs you once a week: links that broke, certificates running out, container updates, and bookmarks nobody opens. A card on the dashboard, Your week in nextDash, opens it in a window with a button to the view where each part is dealt with.
- Tell it to leave one alone: press n or z on a row and that one condition is set aside while the bookmark keeps being checked. An Ignored filter lists everything you have put aside.
- Ten links, two minutes: a corner card names what is waiting and runs Work through over the worst ten.
- Repair, not just diagnosis: follow redirects in one action after a domain move, or point a dead link at its last Web Archive capture.
Containers: the other half of a homelab
$ Containers: see it in action →
$ Status page: see it in action →
$ App icons: see it in action →
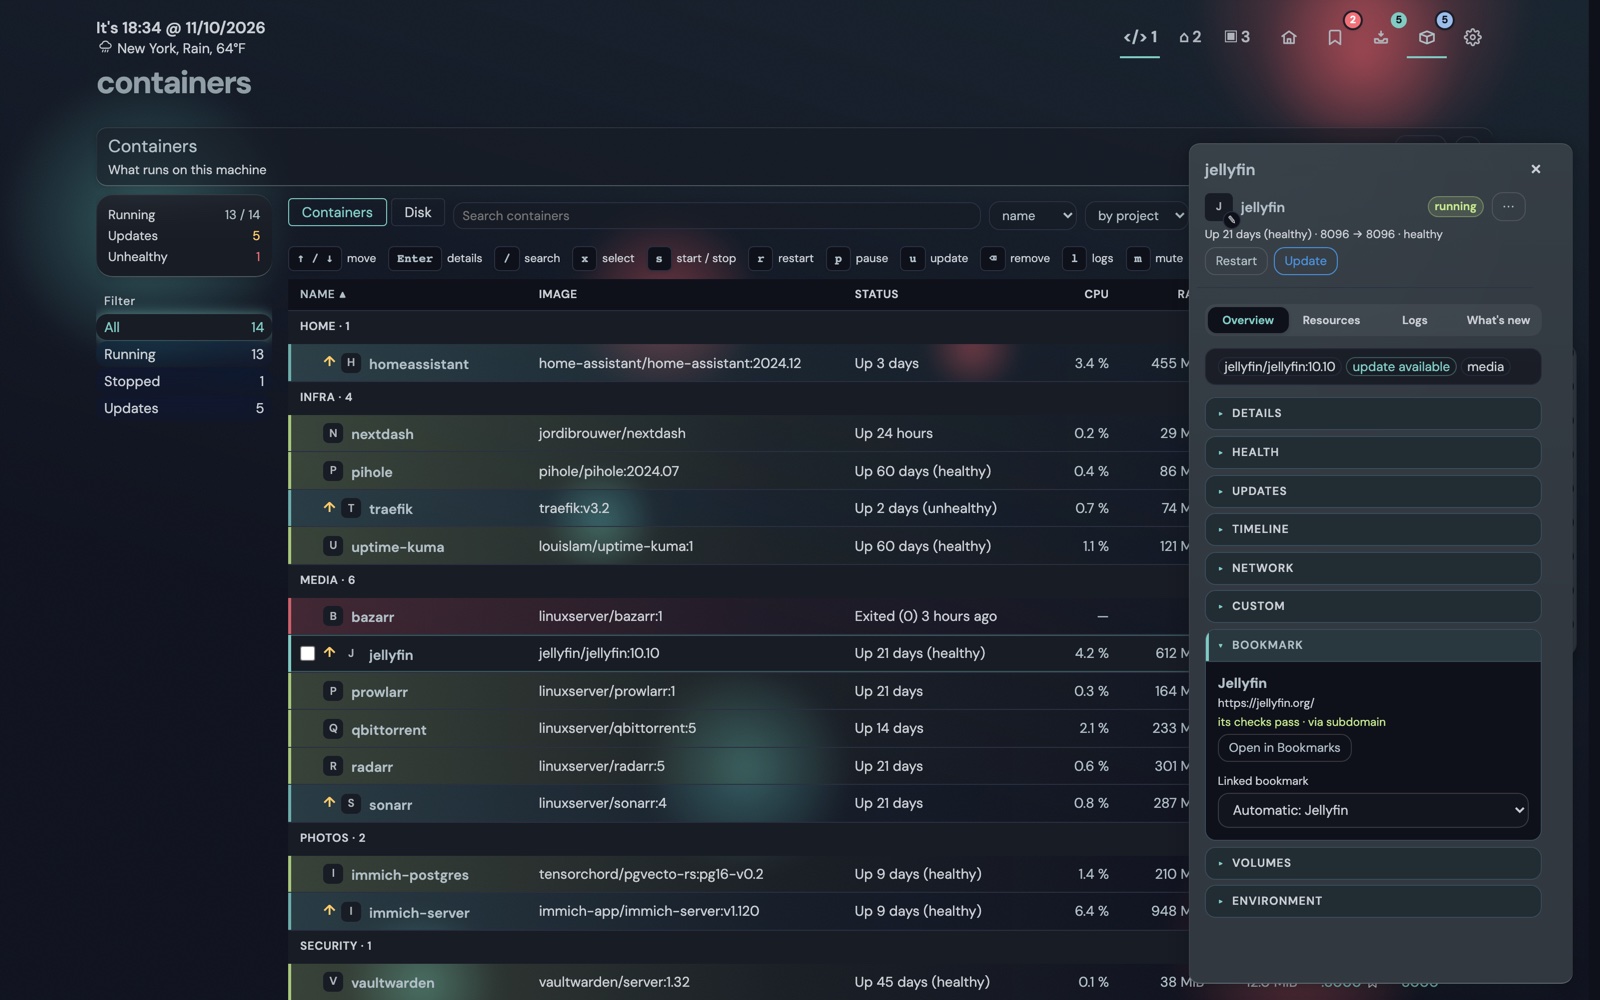
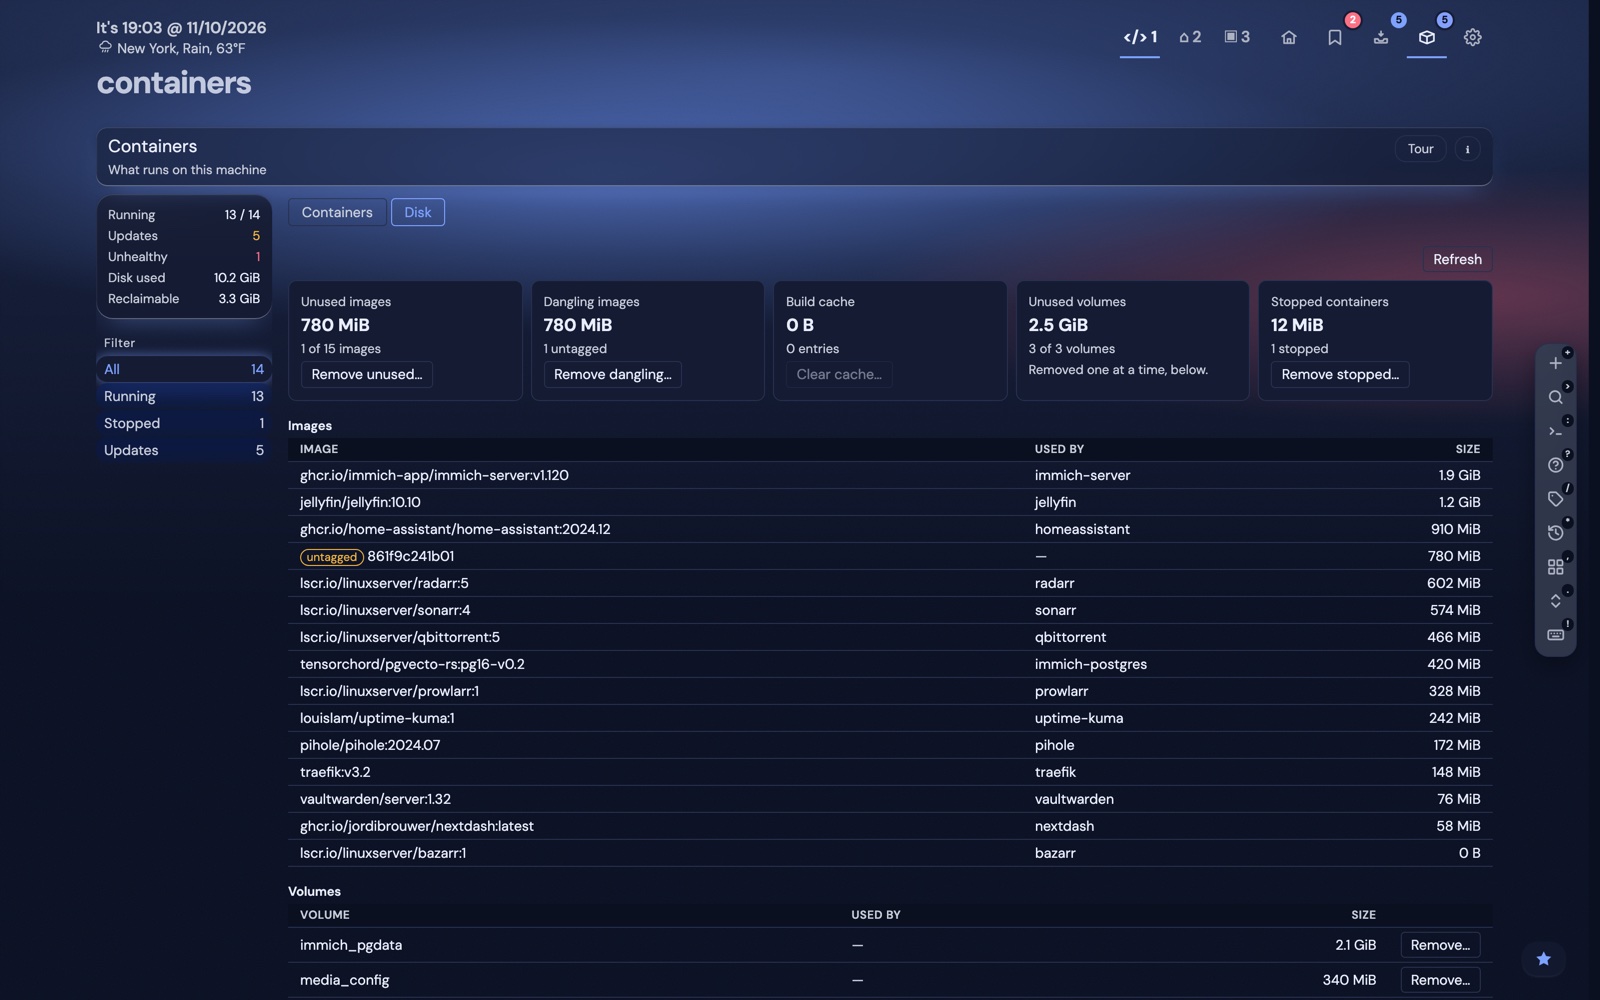
A bookmark dashboard that knows your Docker host too: every container on the machine, grouped by compose project, matched to the bookmark you already have for its web UI.
> Try it: Shift+Y open the demo ↗
One glance per container
Status glow, CPU, RAM and size on disk, grouped by the compose project it belongs to - not an alphabetical wall of names.
Matched to its bookmark
A container's web UI and the bookmark you already saved for it are recognised as the same thing - by port, subdomain or name - so one card covers both.
Control from the keyboard
Start, stop, restart, update or roll back without opening a terminal or Portainer.
Health follows the bookmark
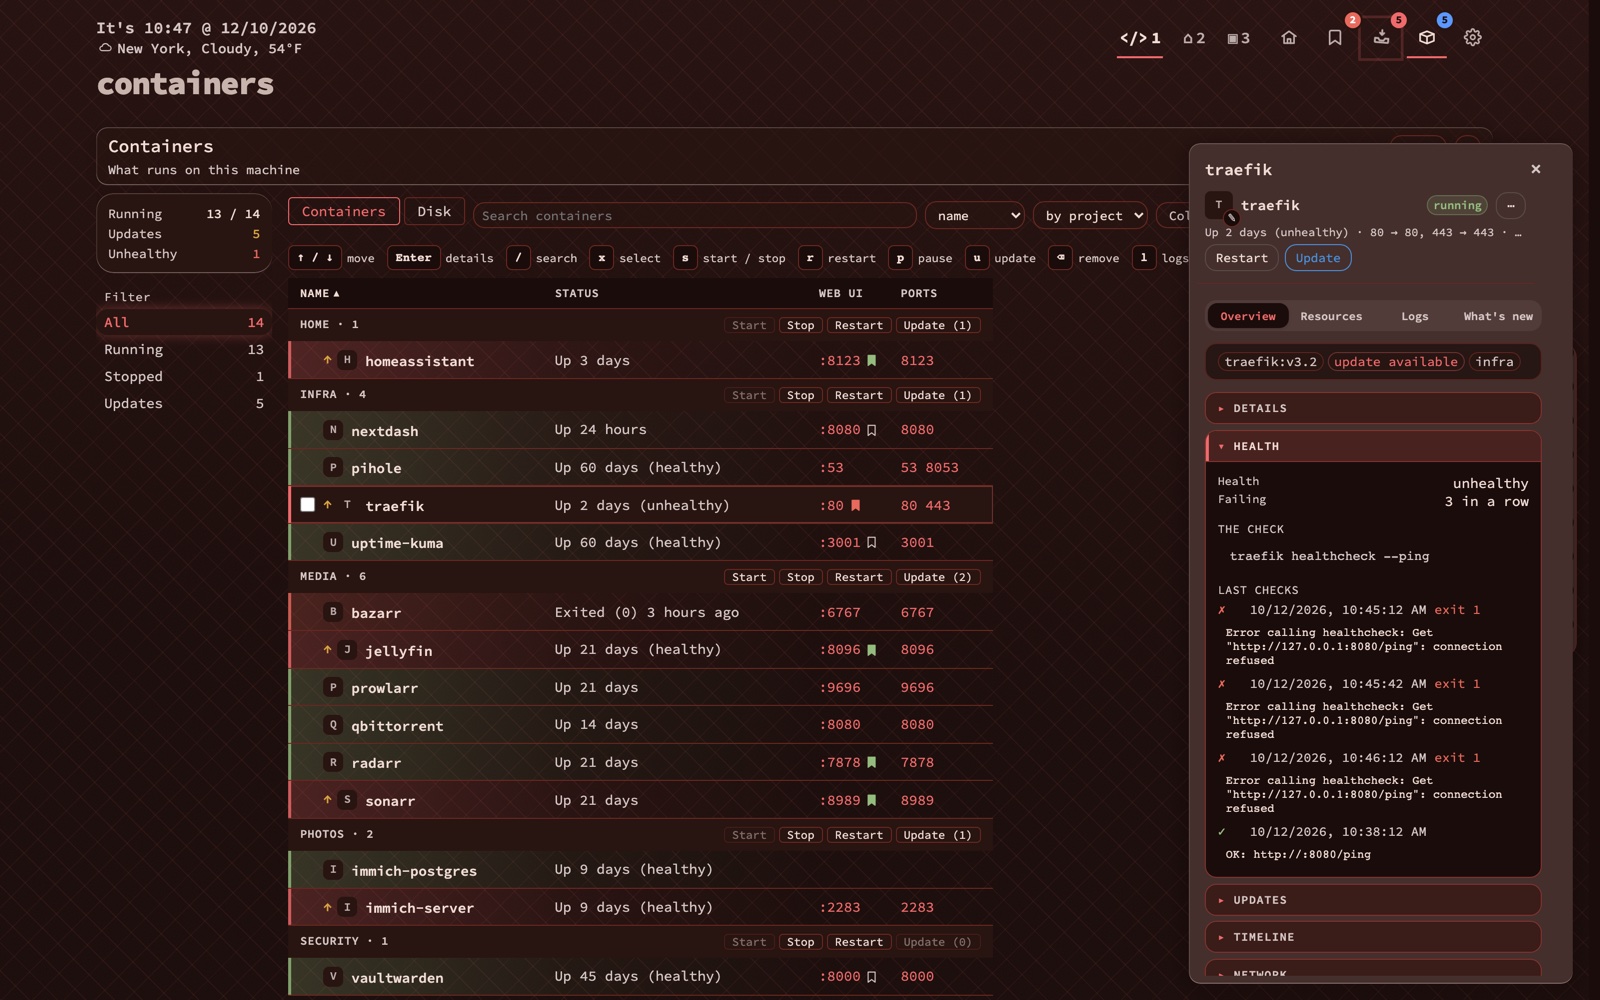
A web UI's bookmark carries its own health mark on the container row - green where the monitor finds it up, red when it does not. The side panel says why: failed healthchecks, a crash, a restart loop since the last update - the same diagnosis Bookmarks would give you, without leaving the Containers view.
Updates, with a way back out
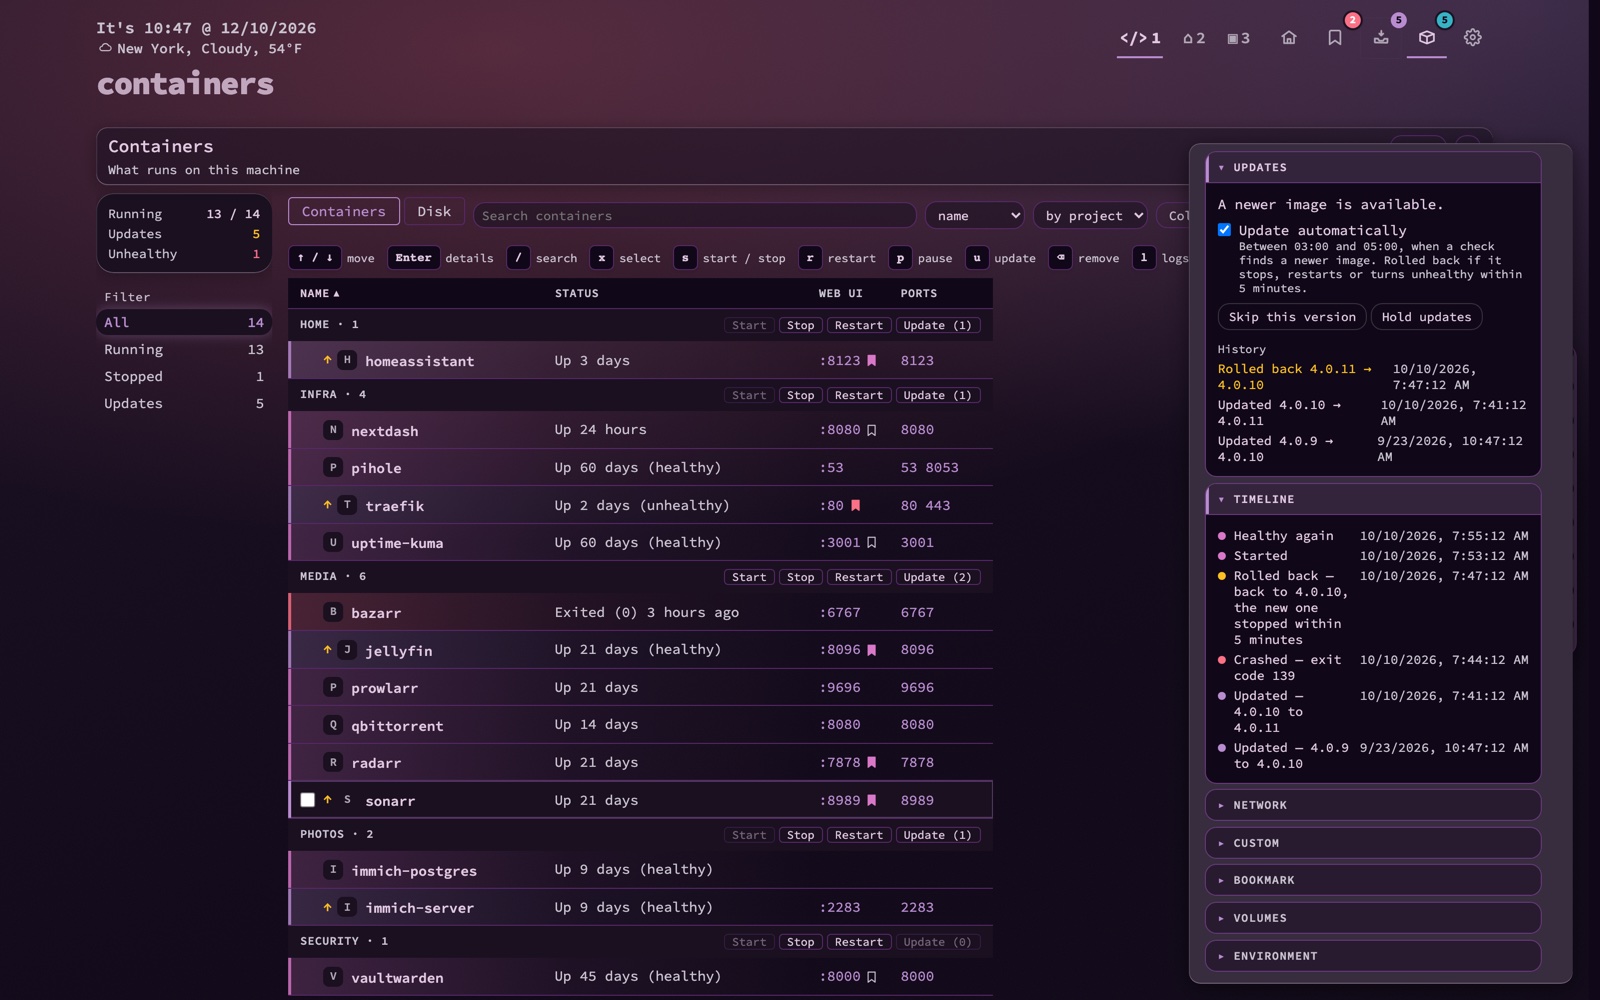
Pick containers that update themselves in a window you choose. Each one is watched for five minutes after; turn unhealthy in that window and nextDash puts it back on its old image and skips that version, with the reason in its Timeline and a notice sent to your phone.
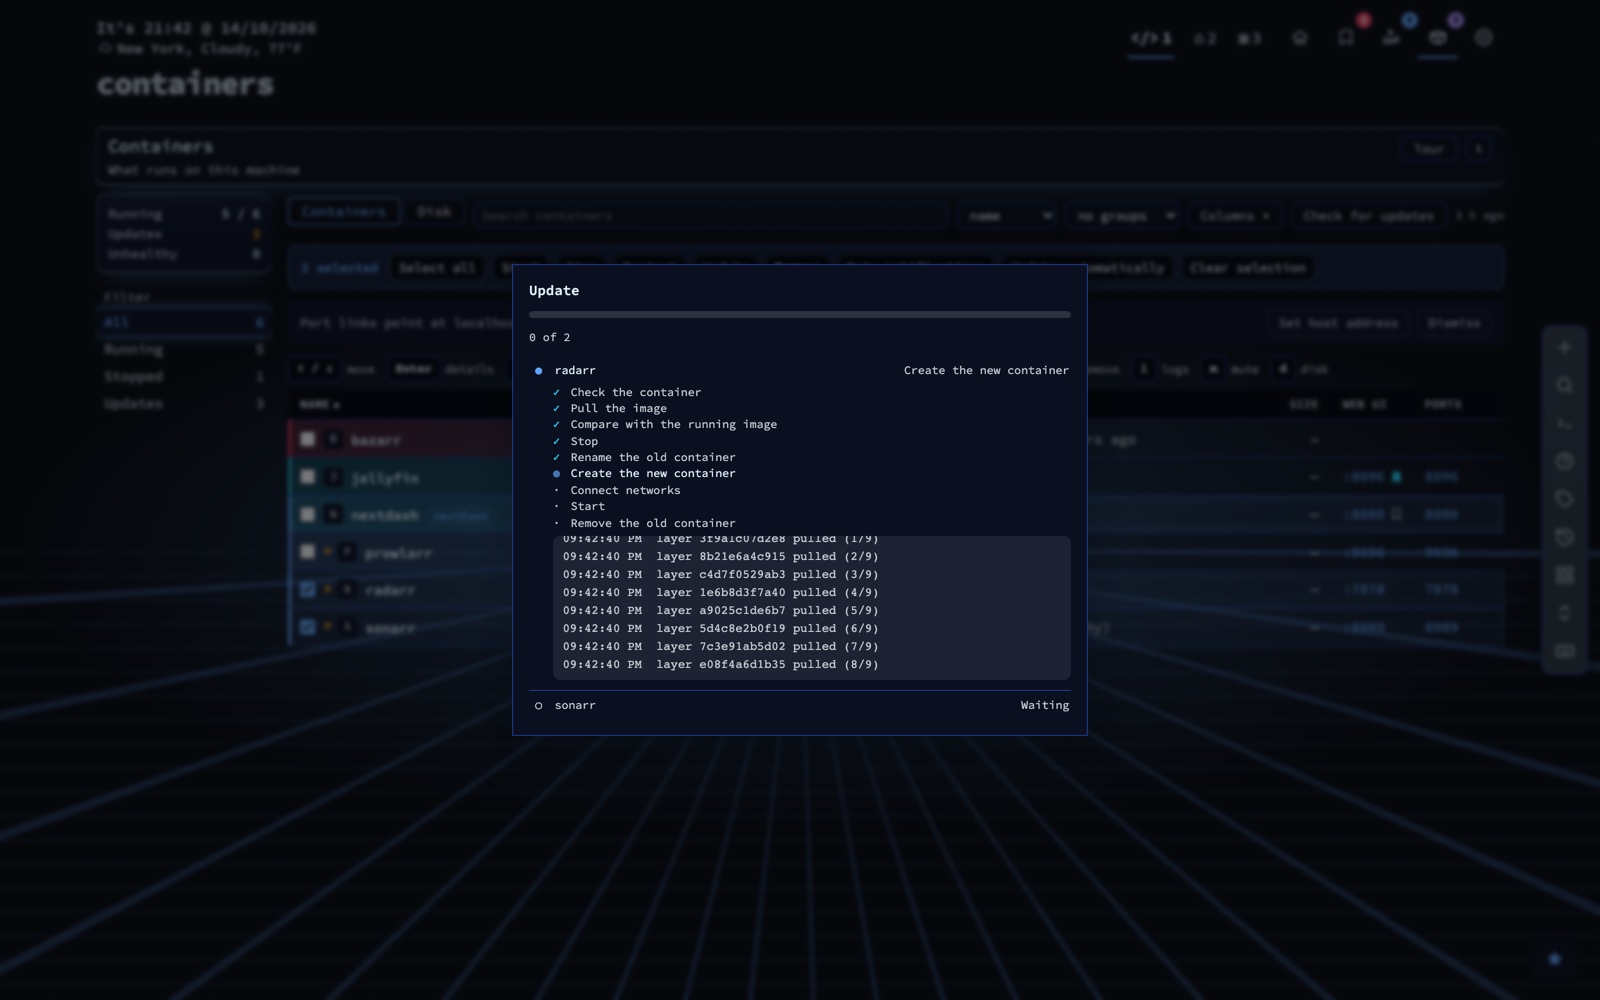
An update or rollback shows its steps while it runs - check, pull, compare, tag, stop, rename, create, connect, start and remove - with a log line for each pulled layer. Update a selection and nextDash takes only the containers that have an update, and says why one was left out. Services get their real app icons from two open icon sets, matched by image and host, with a picker behind the pencil.
Logs follow a container live in their own window. The Disk tab shows what images, volumes and build cache take up and clears it after naming what goes. A container that stops, keeps restarting or runs hot reaches you through the same notices and alert channels as a downed bookmark - one place to learn something on your network needs attention, not two.
Unraid, read directly
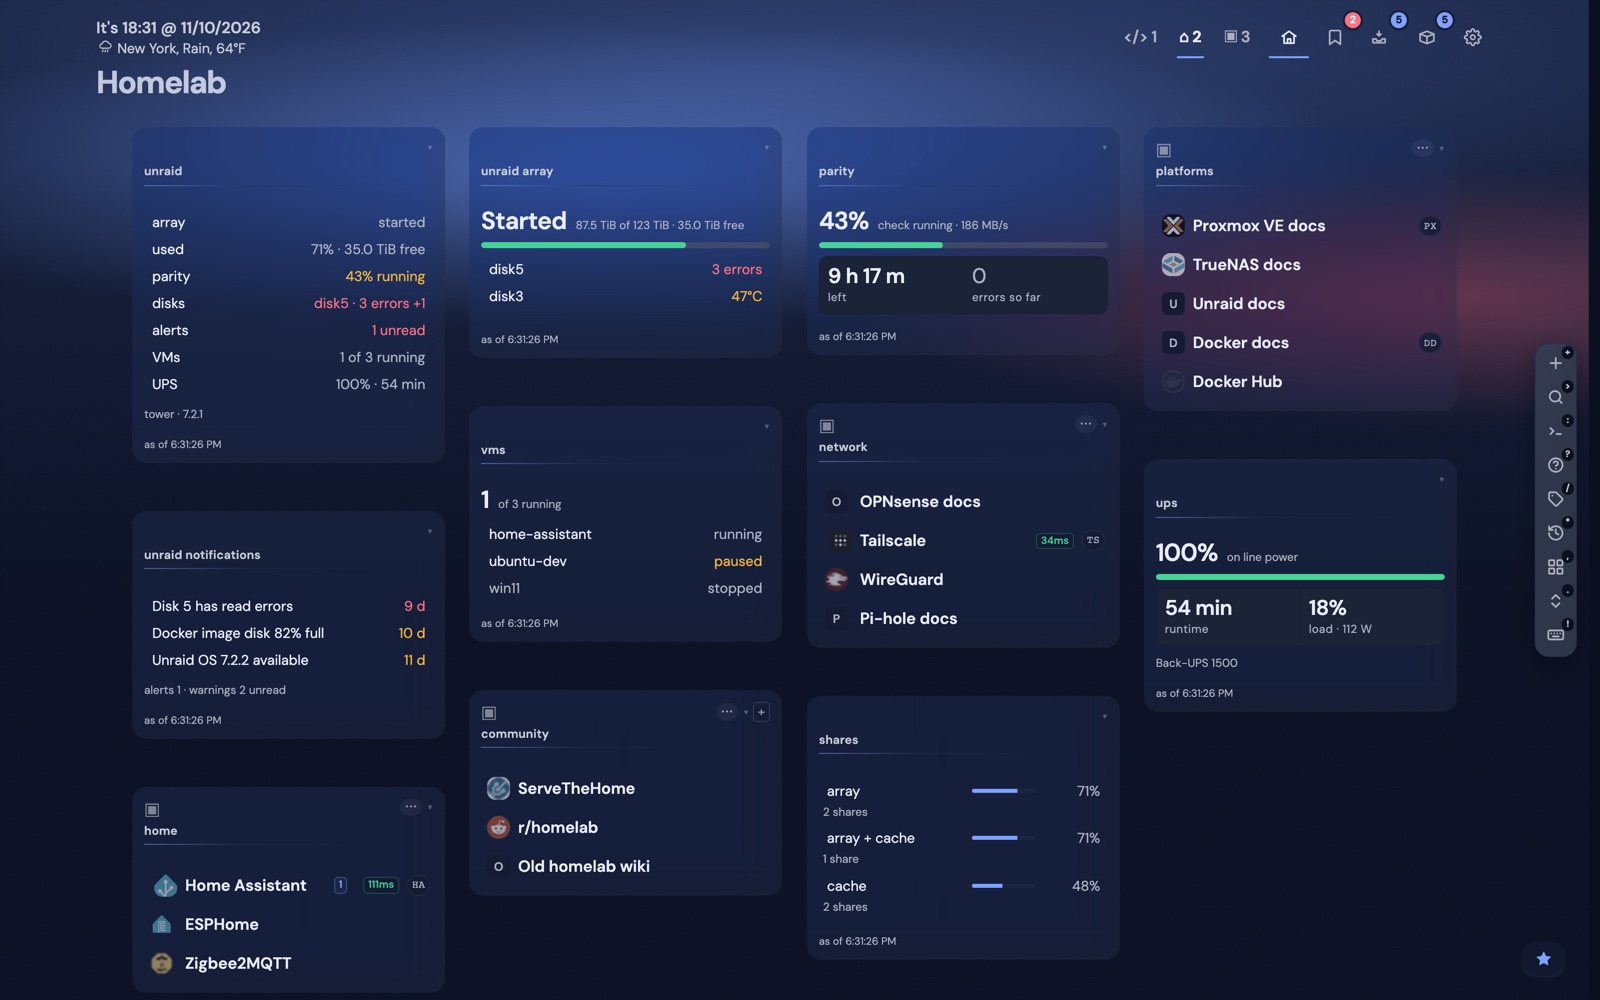
For an Unraid box, nextDash talks to Unraid's own API - a Viewer-role key is all it asks for - and turns the array, the parity check, shares, VMs, the UPS and notifications into seven read-only widgets next to the bookmarks you already have.
Overview
The server at a glance
Array
Every disk, with fill and temperature
Parity
Last check or live progress
Shares
Where they live, how full
VMs
Running, paused, crashed
UPS
Charge, runtime, load
Notifications
Unread, alerts in red
Read-only by design: a Viewer key can show you a parity check is running, it cannot start or cancel one. A disk dropping out of the array, a parity error, or the UPS switching to battery reaches you through the same alert channels as a downed bookmark or a crashed container.
Install it from Community Applications
nextDash has an Unraid template: search for nextDash in Community Applications. The connection to the server is set once under Config -> Unraid with a Viewer API key; the Unraid chapter of the manual walks through it.
Widgets: a dashboard that holds more than links
$ Custom widgets: see it in action →
$ Moving blocks: see it in action →
$ Notes and QR codes: see it in action →
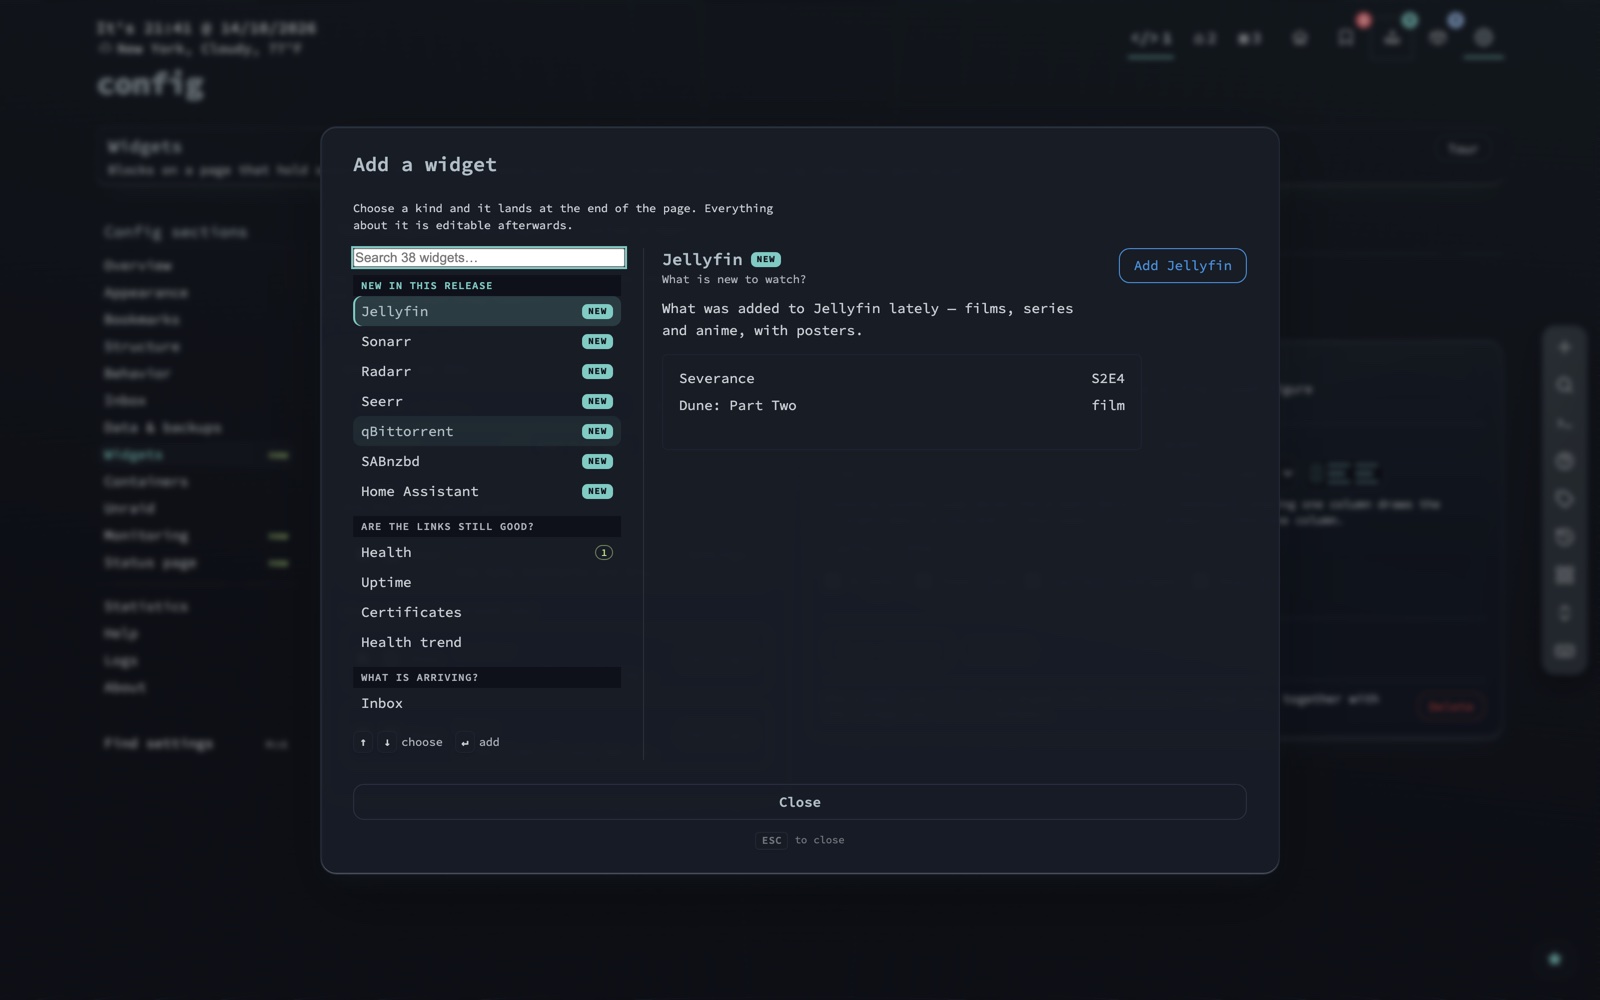
A widget sits among your categories, is dragged into place like one, and can be one or two columns wide. Add, name and arrange them under Config -> Widgets, which has three tabs - Your widgets, Catalogue and Custom widget - and an Add a widget picker you can search. More than thirty built-in tiles, grouped by the question each one answers, and new kinds carry a New badge.
Are the links still good?
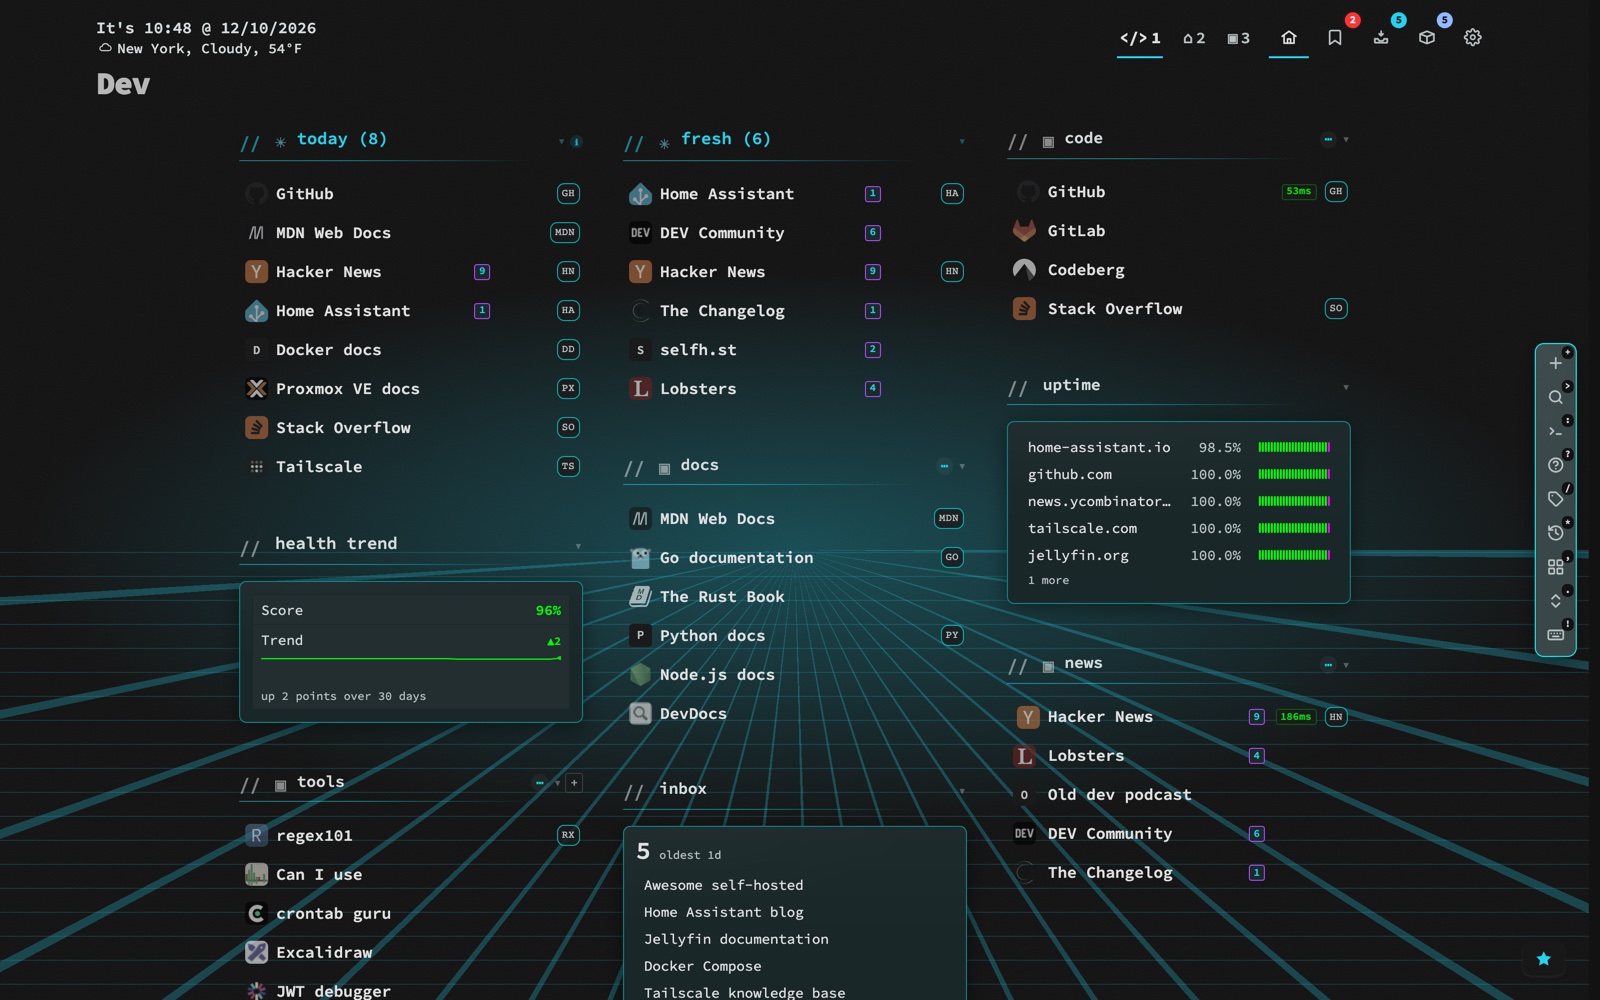
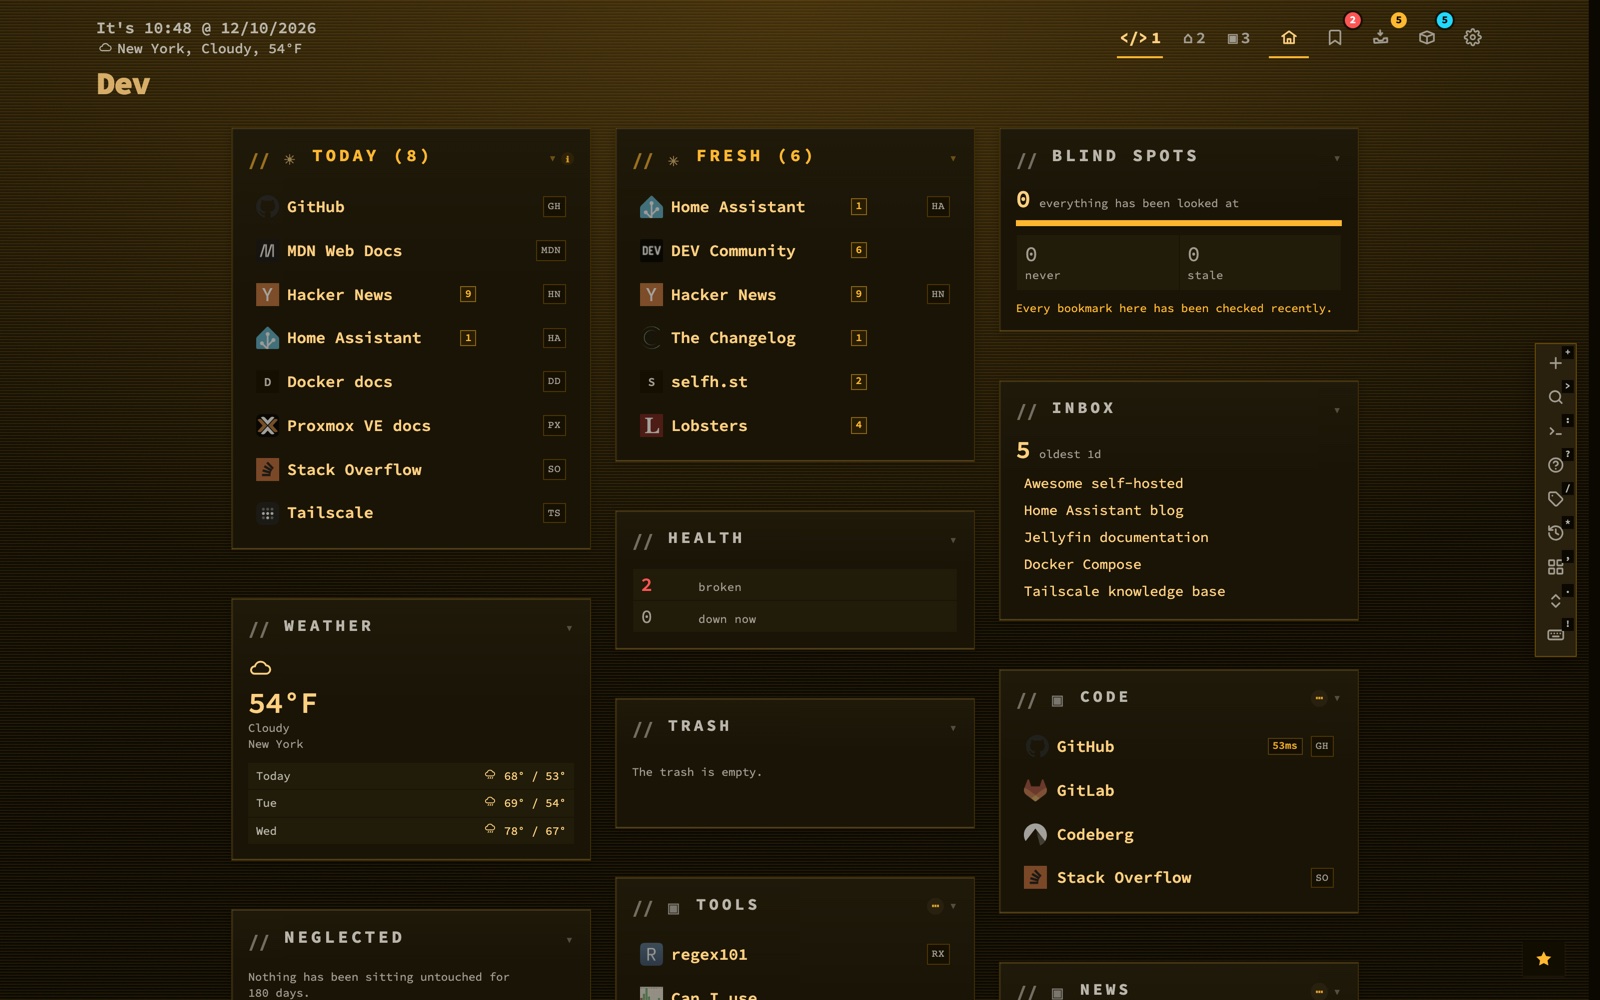
Health, Uptime (worst first, with a heartbeat bar per row), Certificates grouped by host, and Health trend as a line over time.
What is arriving?
Inbox, Unsorted, Feeds and Sources, so a failed import is visible without opening config.
What needs tidying?
Neglected, Blind spots, Duplicates, Archive, Trash and Backups - how old the newest backup is, and whether the last run failed.
How is this machine doing?
Processor, Memory, Disks, Containers and a Container list with problems first. The only widgets that read something outside nextDash.
How is the Unraid server doing?
Seven widgets reading the array, parity, shares, VMs, UPS and notifications.
What is happening around you?
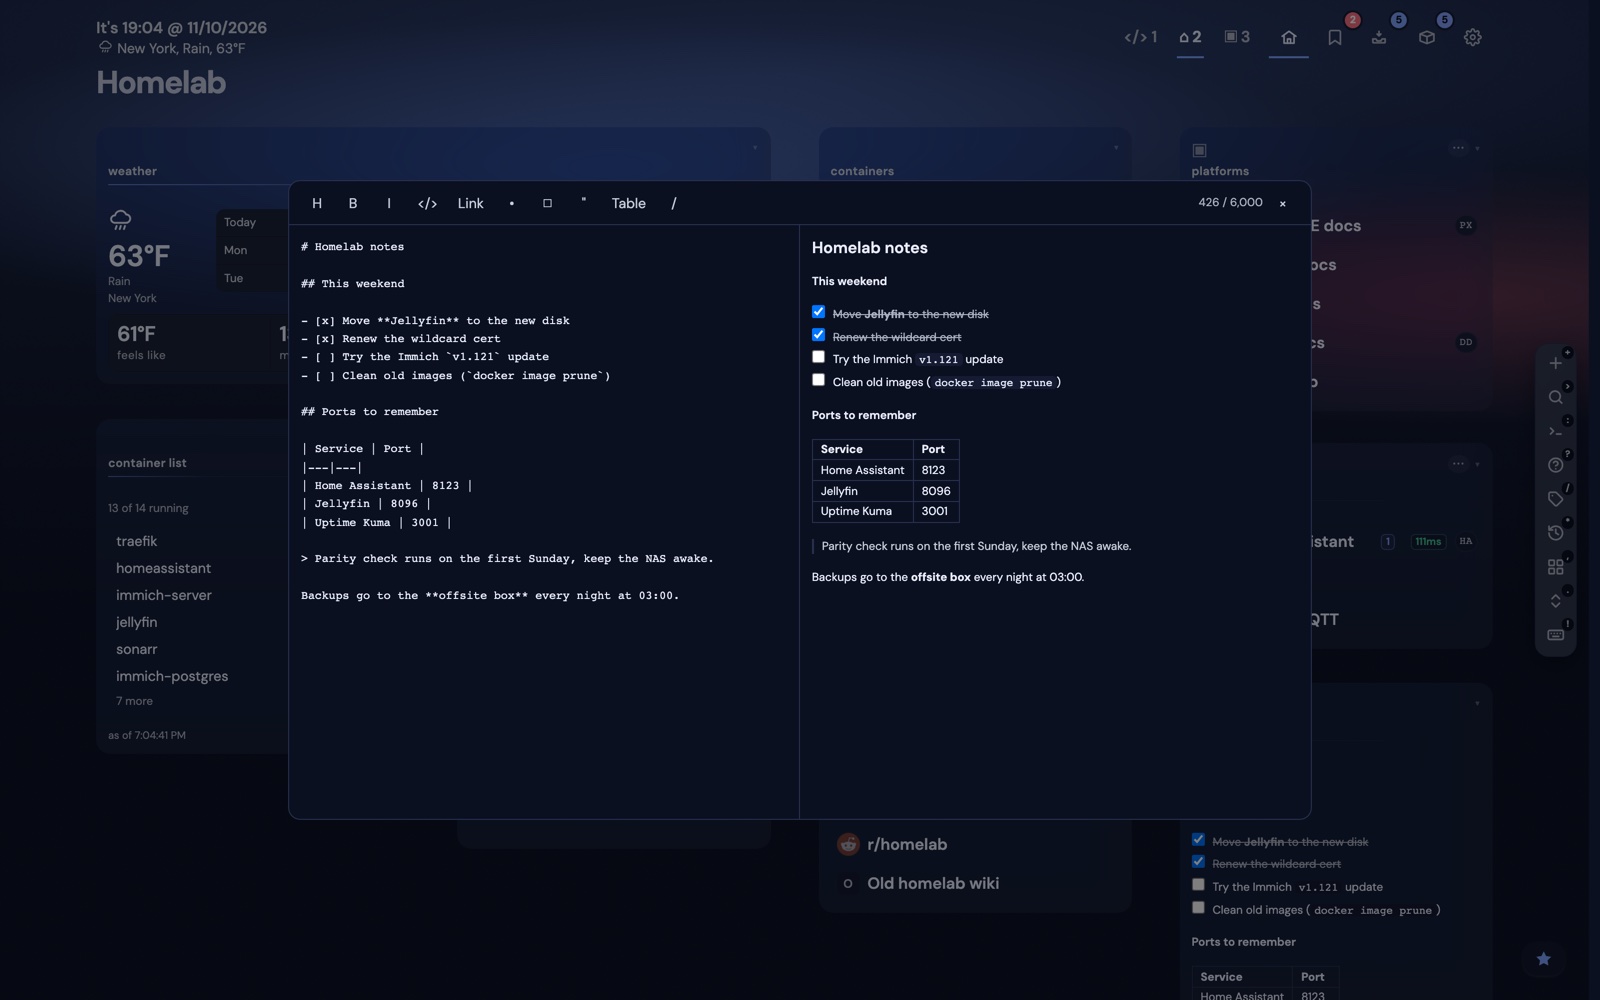
Weather, Calendar from an ICS feed, RSS, and a Notes widget for Markdown and checkboxes.
What is in your media library?
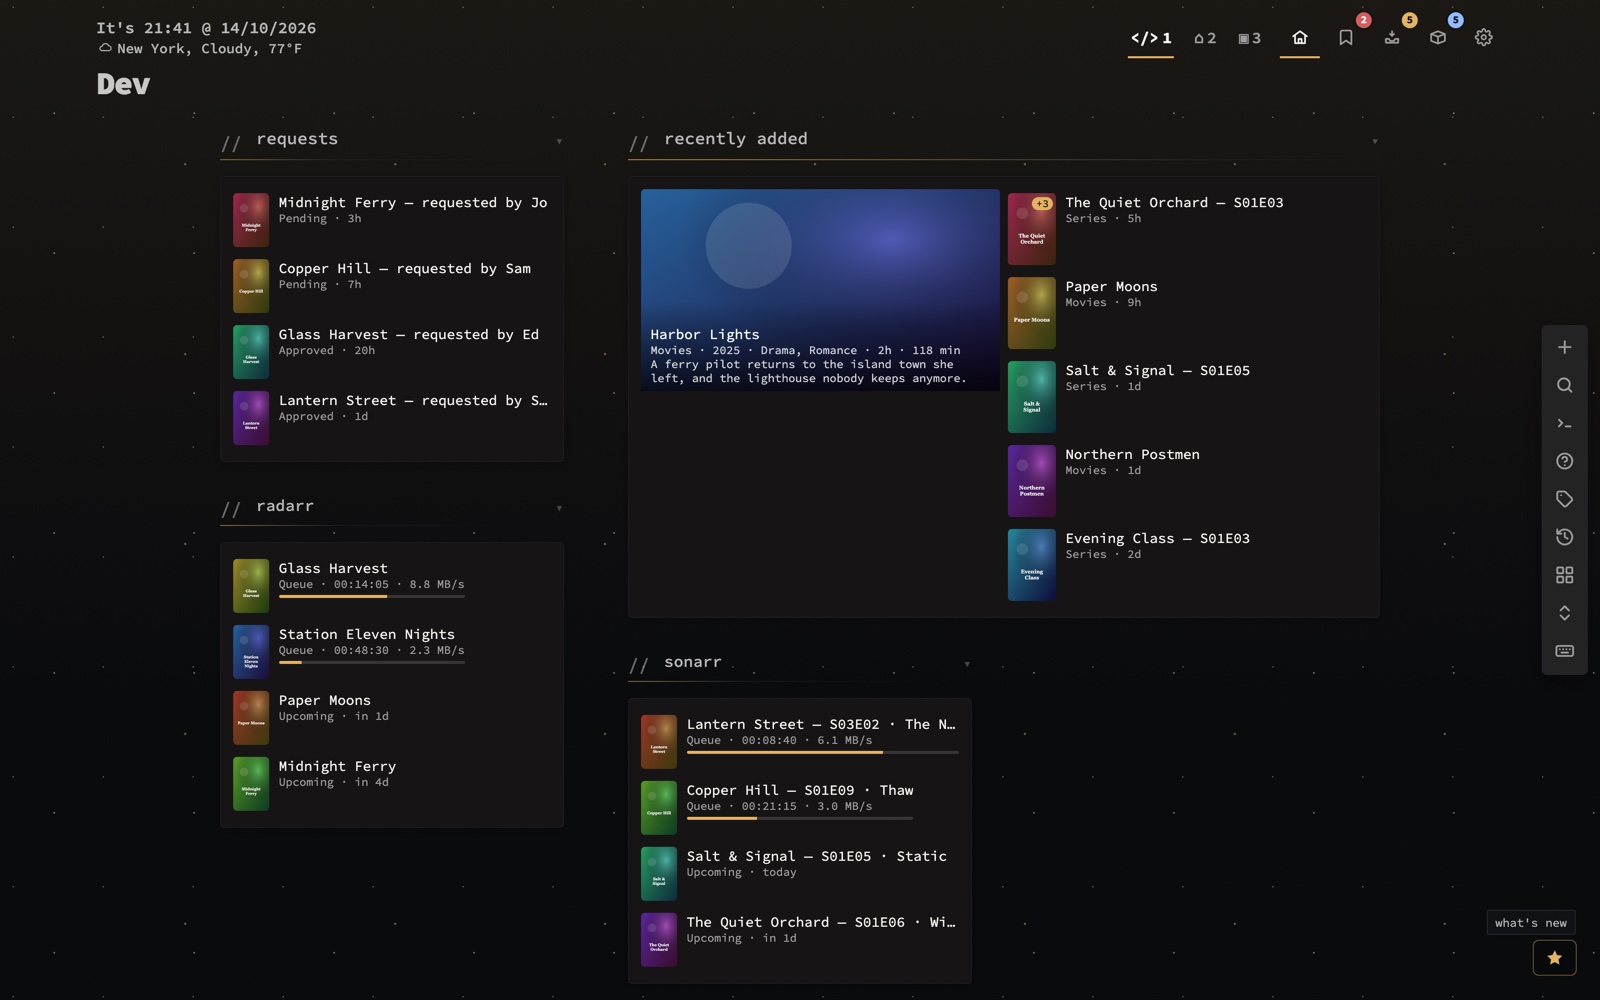
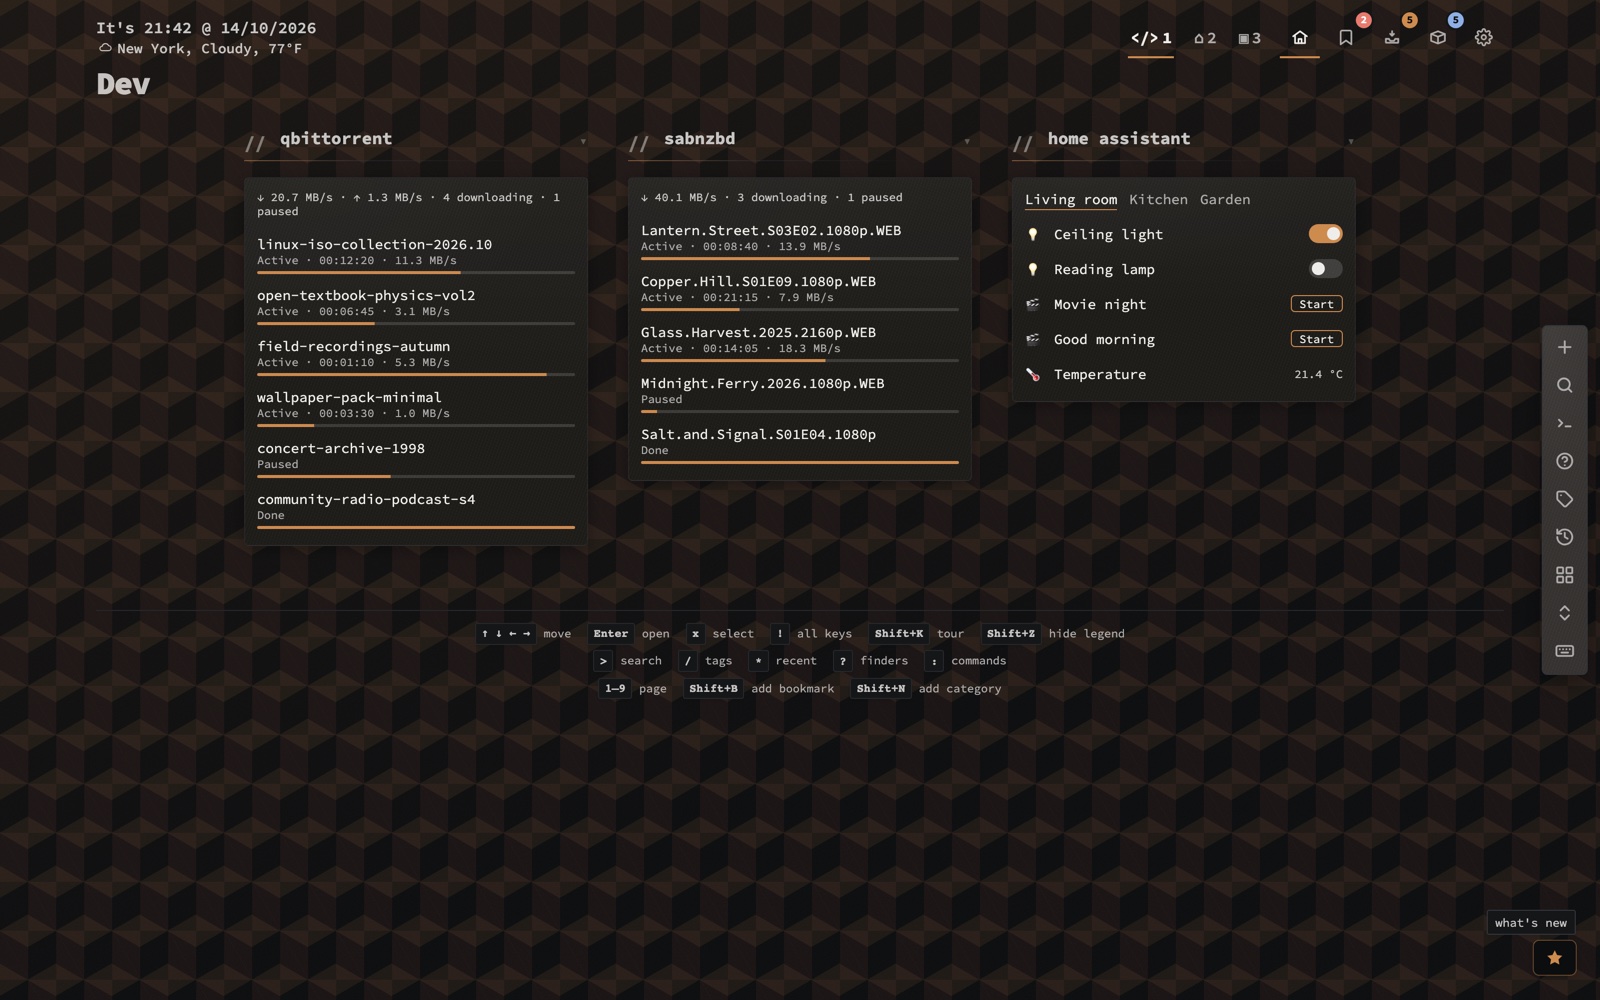
Jellyfin, Sonarr, Radarr, Seerr, qBittorrent and SABnzbd draw real posters, what is coming up, who requested what and what is downloading. A Home Assistant widget switches lights and scenes.
Custom: the escape hatch
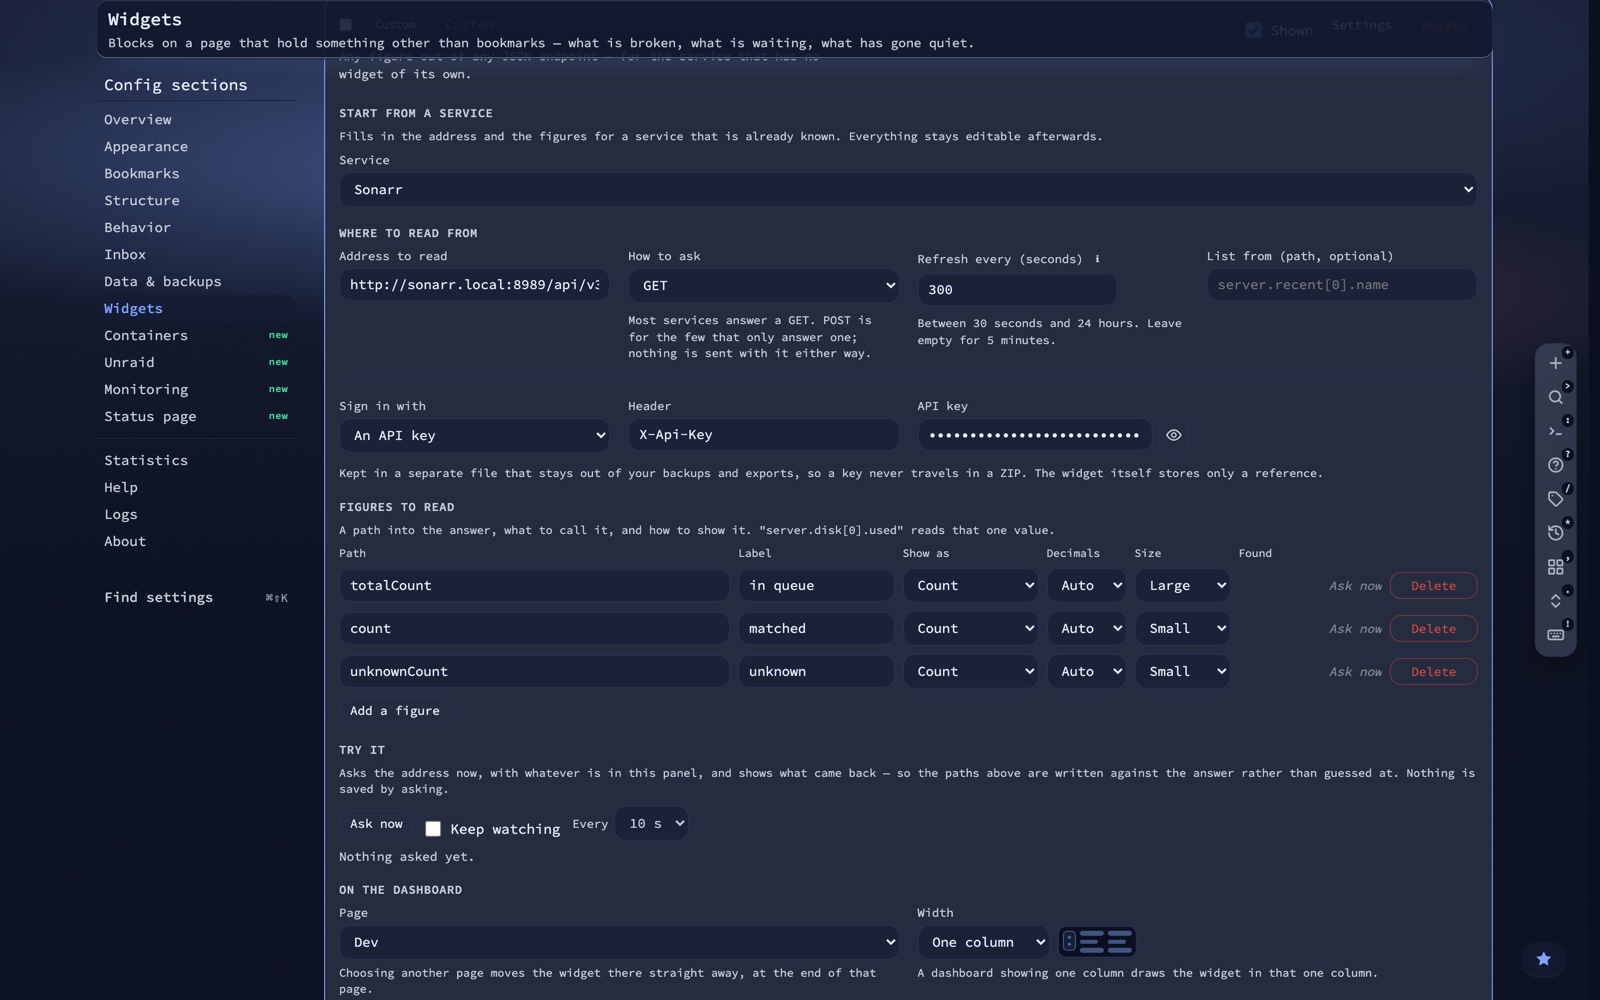
For a service that is not in the list, point a Custom widget at an address that answers with JSON, name the fields, and it draws them. Over forty self-hosted services come pre-filled, from Pi-hole and AdGuard Home to Proxmox, Grafana and Nextcloud. It can use the same stored sign-in as a health check, so no key ever reaches your browser.
Two columns say more, not the same thing larger
A wide widget adds readings the narrow version leaves out: the load average behind the processor's percentage, which container is failing by name, a certificate's exact expiry date. Narrow the dashboard, or open it on a phone, and every tile falls back to the half worth having.
Widgets you can operate
Right-click a widget's title for rename, width, fold, settings and close - close means disable, not delete. Arrow keys step through its rows, Enter opens the one under the cursor, and a figure on a tile opens the rows behind it.
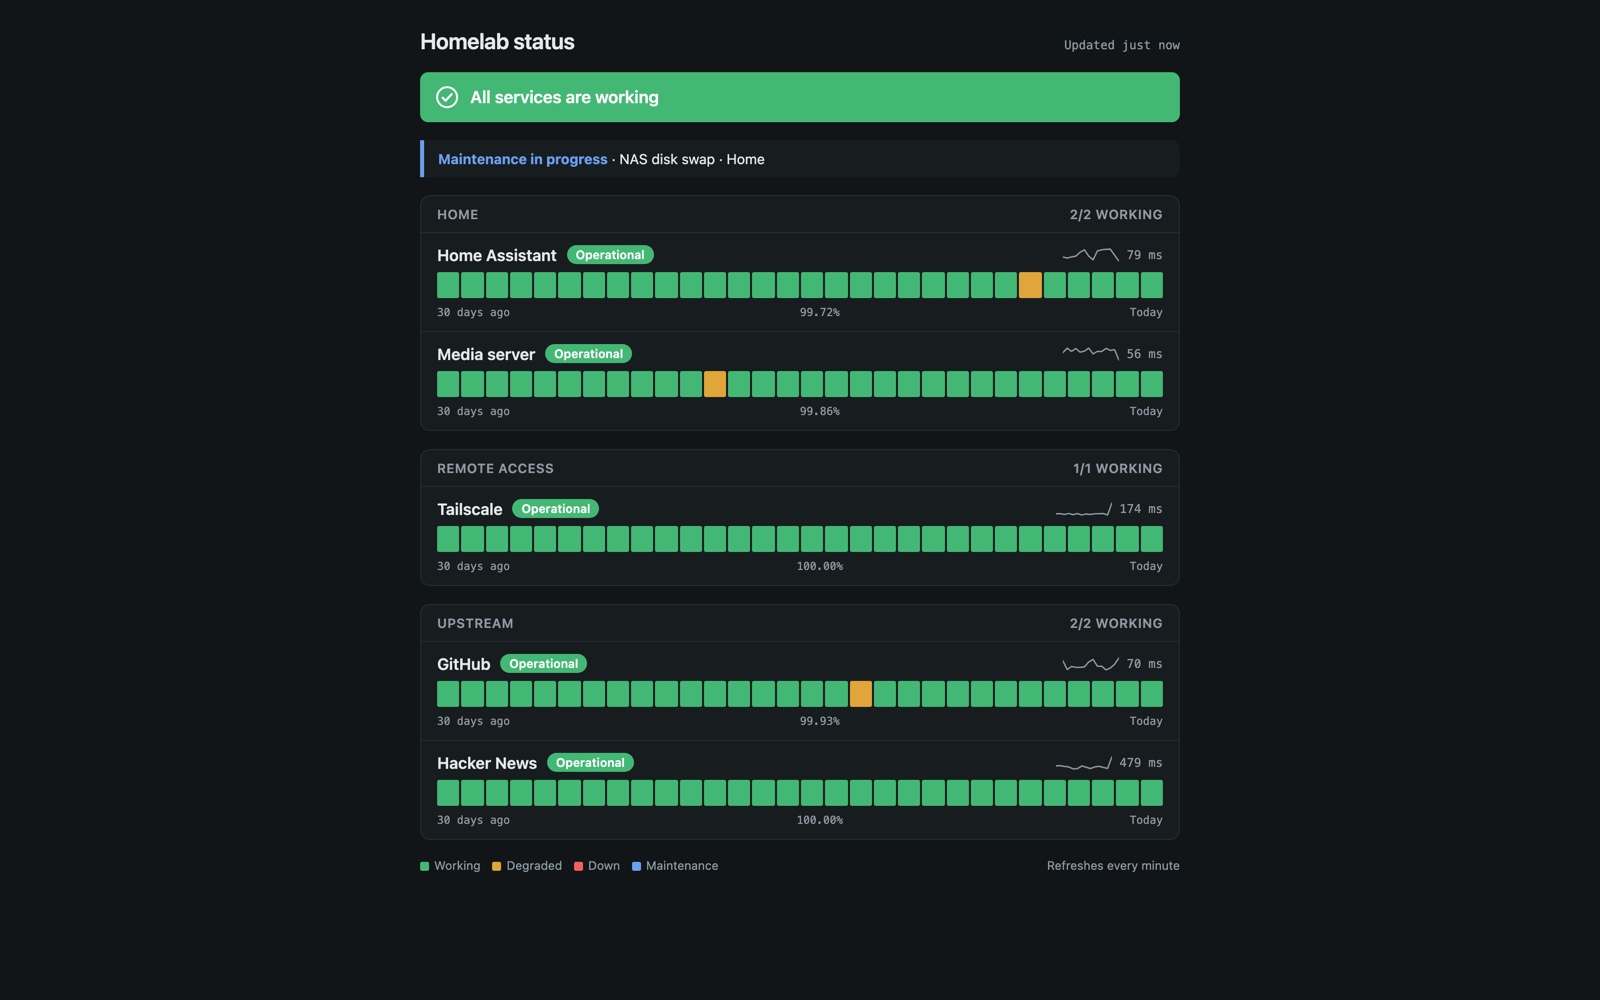
A status page you can share
Your monitors can be shared as a read-only status page at /s/<token>, with 30-day bars and maintenance notices.
Make it look like yours
$ Theme studio: see it in action →
This is a page you look at every day. nextDash ships over 300 themes - 160 families with a dark and a light half - and each has a character of its own, not just a different palette. Twelve characters decide what kind of surface a theme draws: lacquer, glass, frost, aurora, neon, velvet, enamel, brushed, carbon, paper, terminal, ink. Glass is something you look through; velvet keeps its light in the shadow beneath; neon lets the accent leave the surface as a halo.
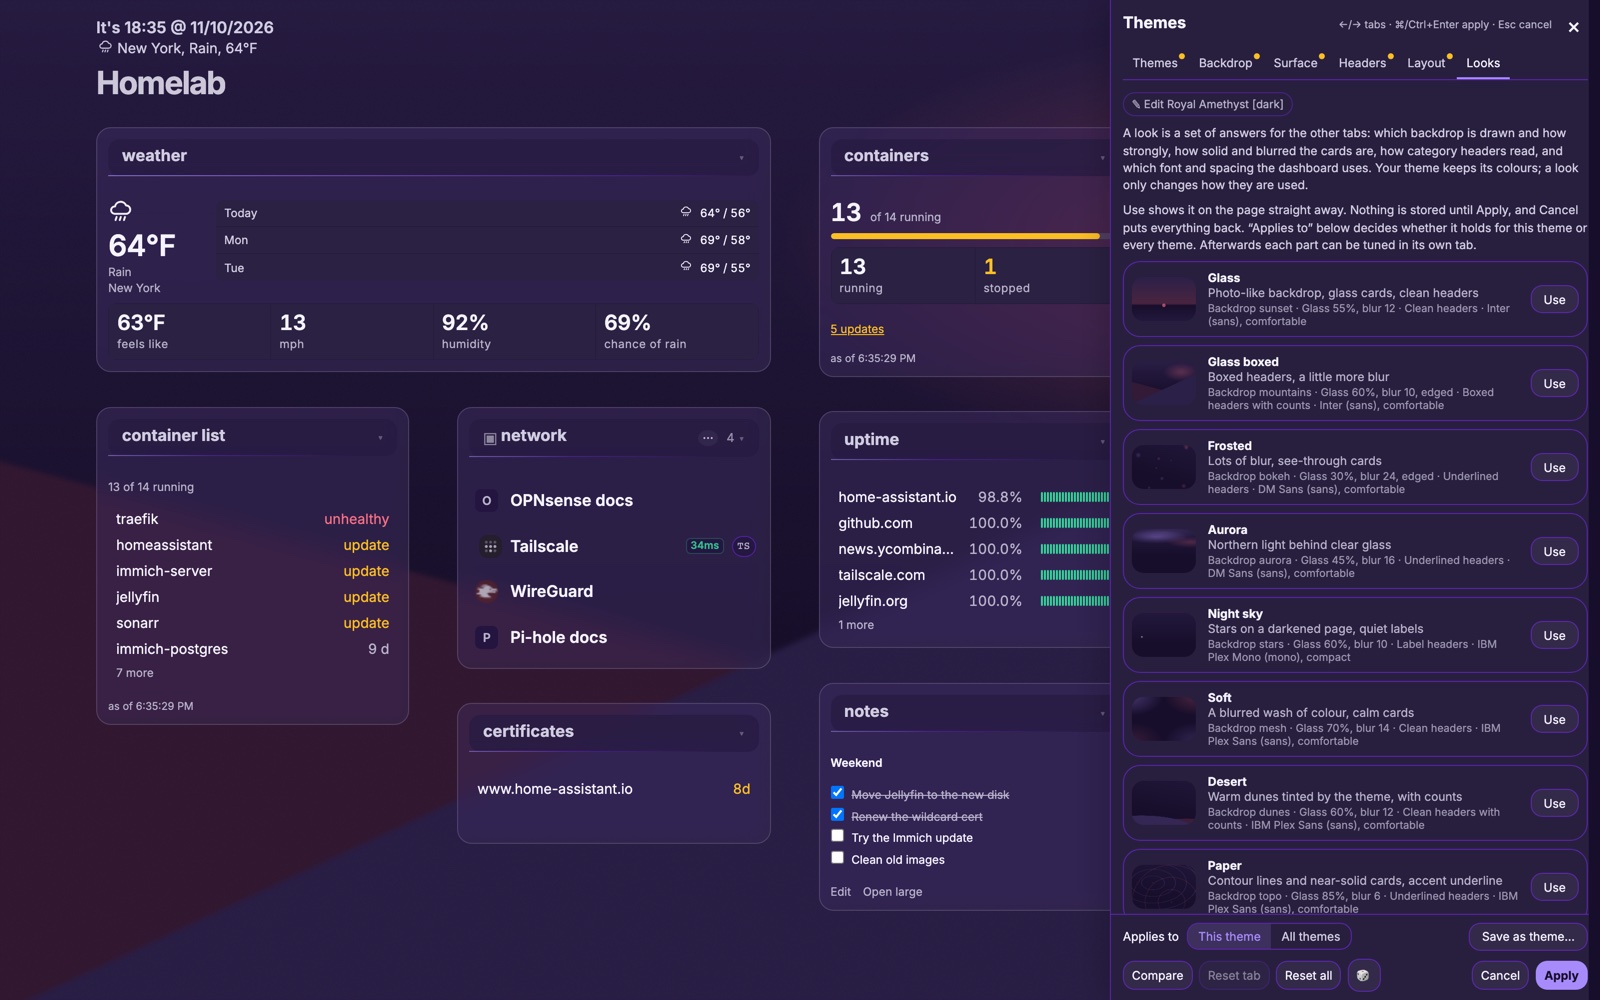
The same dashboard, four looks. Same data, same layout - only the studio settings change.


> Try it: Shift+A open the demo ↗
The studio opens beside your dashboard and changes the real page as you go: the theme, a couple of dozen backdrops drawn in its colours, depth, glow and card glass, the category headers, the type and the contrast - or one of a dozen ready-made looks that set them all at once. Compare shows what you had, a dice icon tries something at random, and nothing is saved until Apply.
Twelve themes, each in light and dark
The page is the same every time. The theme is not, and neither are the settings that go with it: look, backdrop, glass, depth, glow, headers, type and density. Below is a gallery: click through the twelve themes and switch each one between light and dark.

> Pick a theme below, flip between dark and light, or use the arrow keys. Click the big picture to enlarge it.
Custom colours
A full editor at #config/colors: edit the packaged families, build your own, export and import them, see contrast warnings live.
Layout presets
Default, Compact, Cards, Masonry, List, Launcher (large favicon tiles) and Widgets, which fills the dashboard with a ready-made set of widgets to try.
Fonts
Seven UI presets: Source Code Pro (the default), JetBrains Mono, IBM Plex Mono, Inter, IBM Plex Sans, DM Sans, System UI.
The action bar
Five positions, five button sizes, per-button show/hide, and a choice of intro animations. Hiding a button leaves its shortcut working.
Branding & PWA
A custom title and favicon apply to the browser tab, the web app manifest, and the installed app's name and icon on your home screen.
Six languages
The interface is available in six languages.
Config, organised and not overwhelming
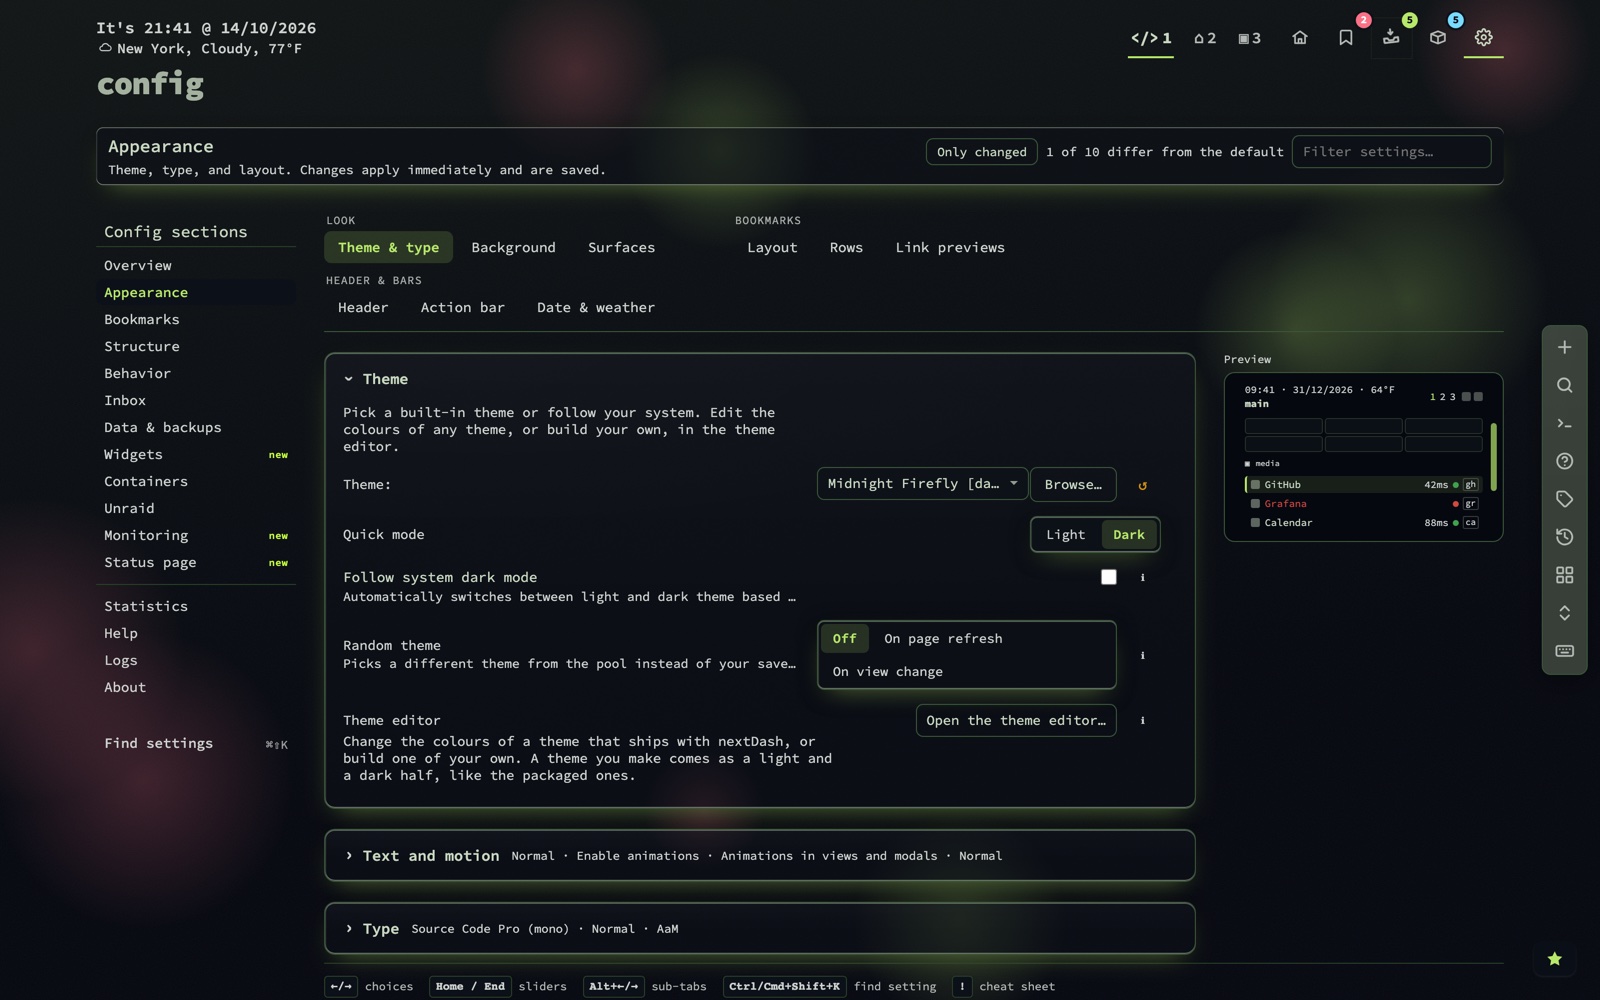
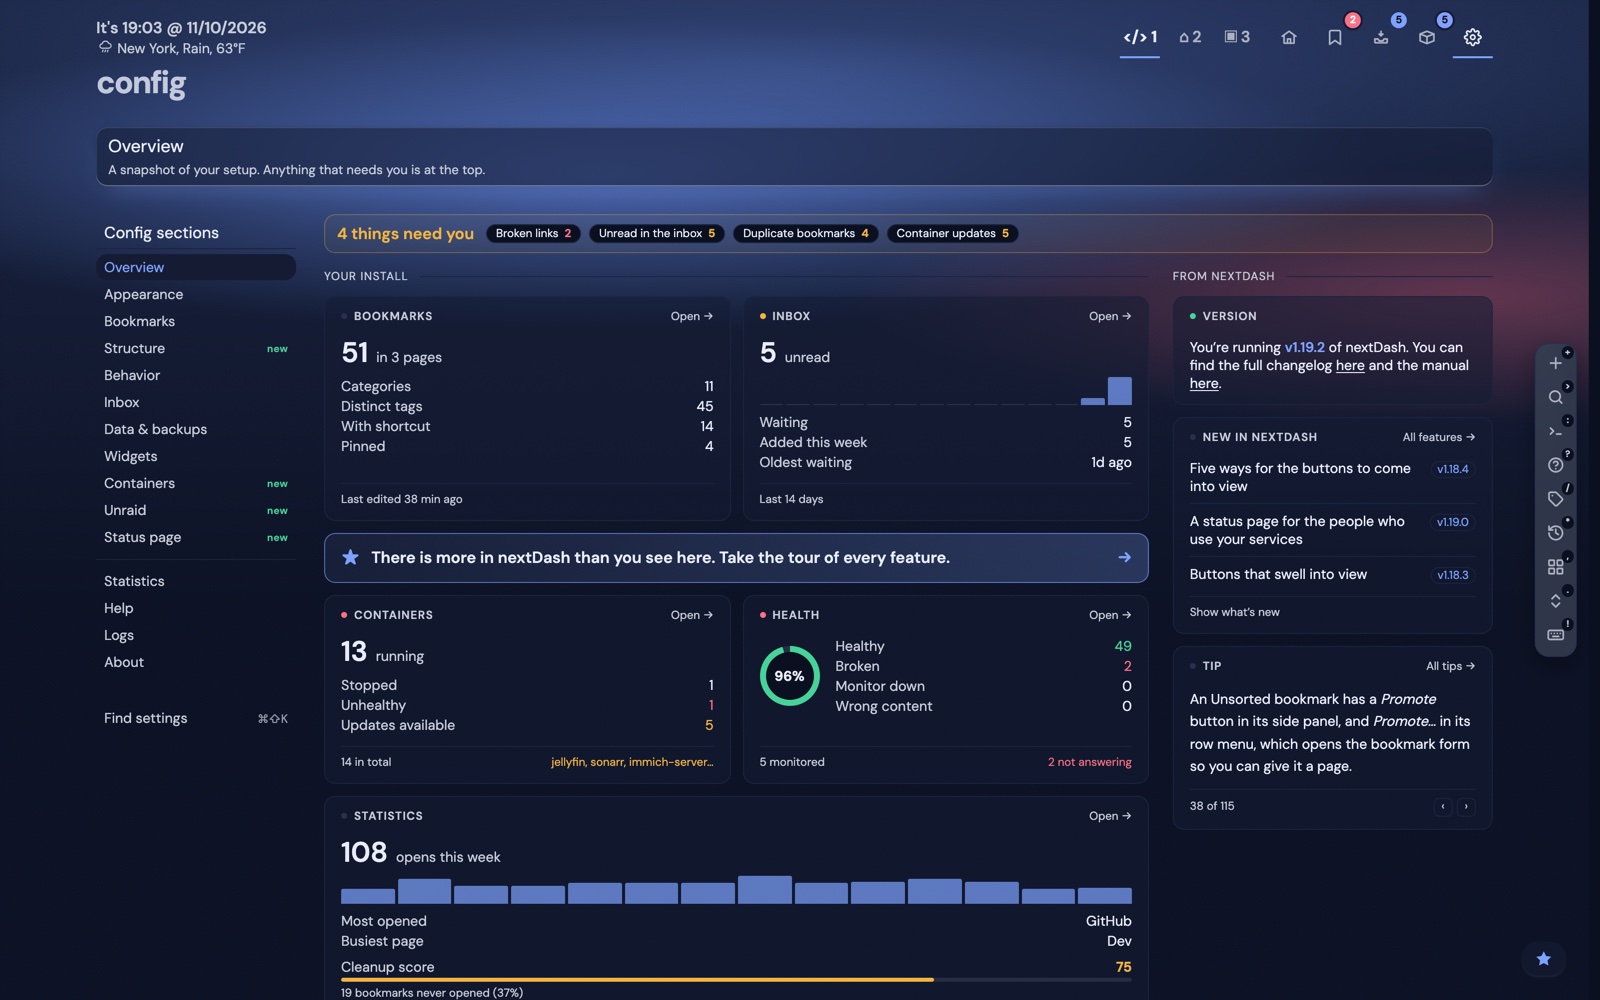
Appearance has nine tabs in three groups, and its panels fold up to a line showing what they are set to. Every section is deep-linkable and opens on cards for the few settings a group leads with, rather than a wall of every option. An At a glance panel shows how many settings differ from default, an Only changed filter sits above every tab, and Ctrl/Cmd+Shift+K finds a setting by name or by its current value.
Copies, collections and automation
$ Collections: see it in action →
Three things that make the library keep itself in order: copies that outlast the original, collections that reorganise around what you actually do, and hooks so other tools can listen and ask.
Keeping a copy of a page
Ask the Web Archive
Keep a copy the day you save a link. Switch it on under Config -> Data & backups -> Sources, with an archive.org key pair and a one-page test capture to prove them.
Keep a copy on your own disk
Local copies save a whole page - text, styling and images - as one file, so it stays readable even if the site and the Web Archive are both gone.
See what you have saved
Config -> Bookmarks -> Local copies lists them grouped by the bookmark they belong to.
Collections, tags and Fresh
Today (your keyword sets), Recently opened, Most used, Stale, Fresh (bookmarks whose site published something new), one collection per tag, and your own rules on category, tag, page, status, pinned, untagged, or days since last opened. Fresh reads the head of every saved page, notes any RSS or Atom feed advertised there, and polls it hourly. It stores no articles, only how many entries are newer than your last visit - it is not a feed reader.
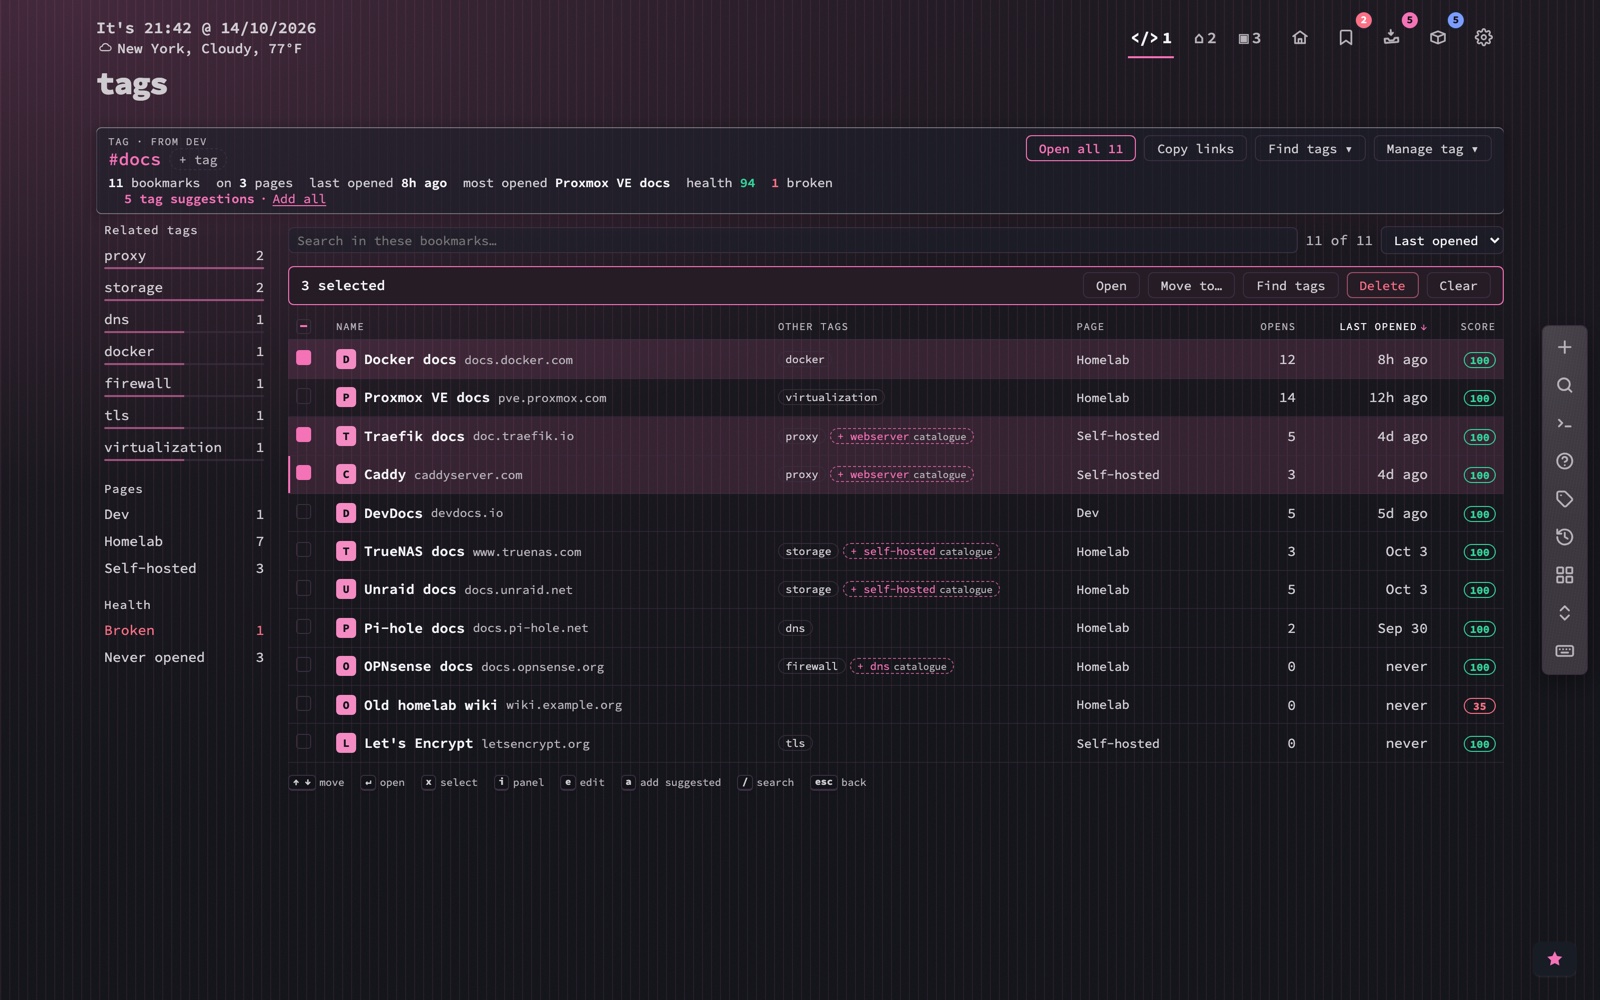
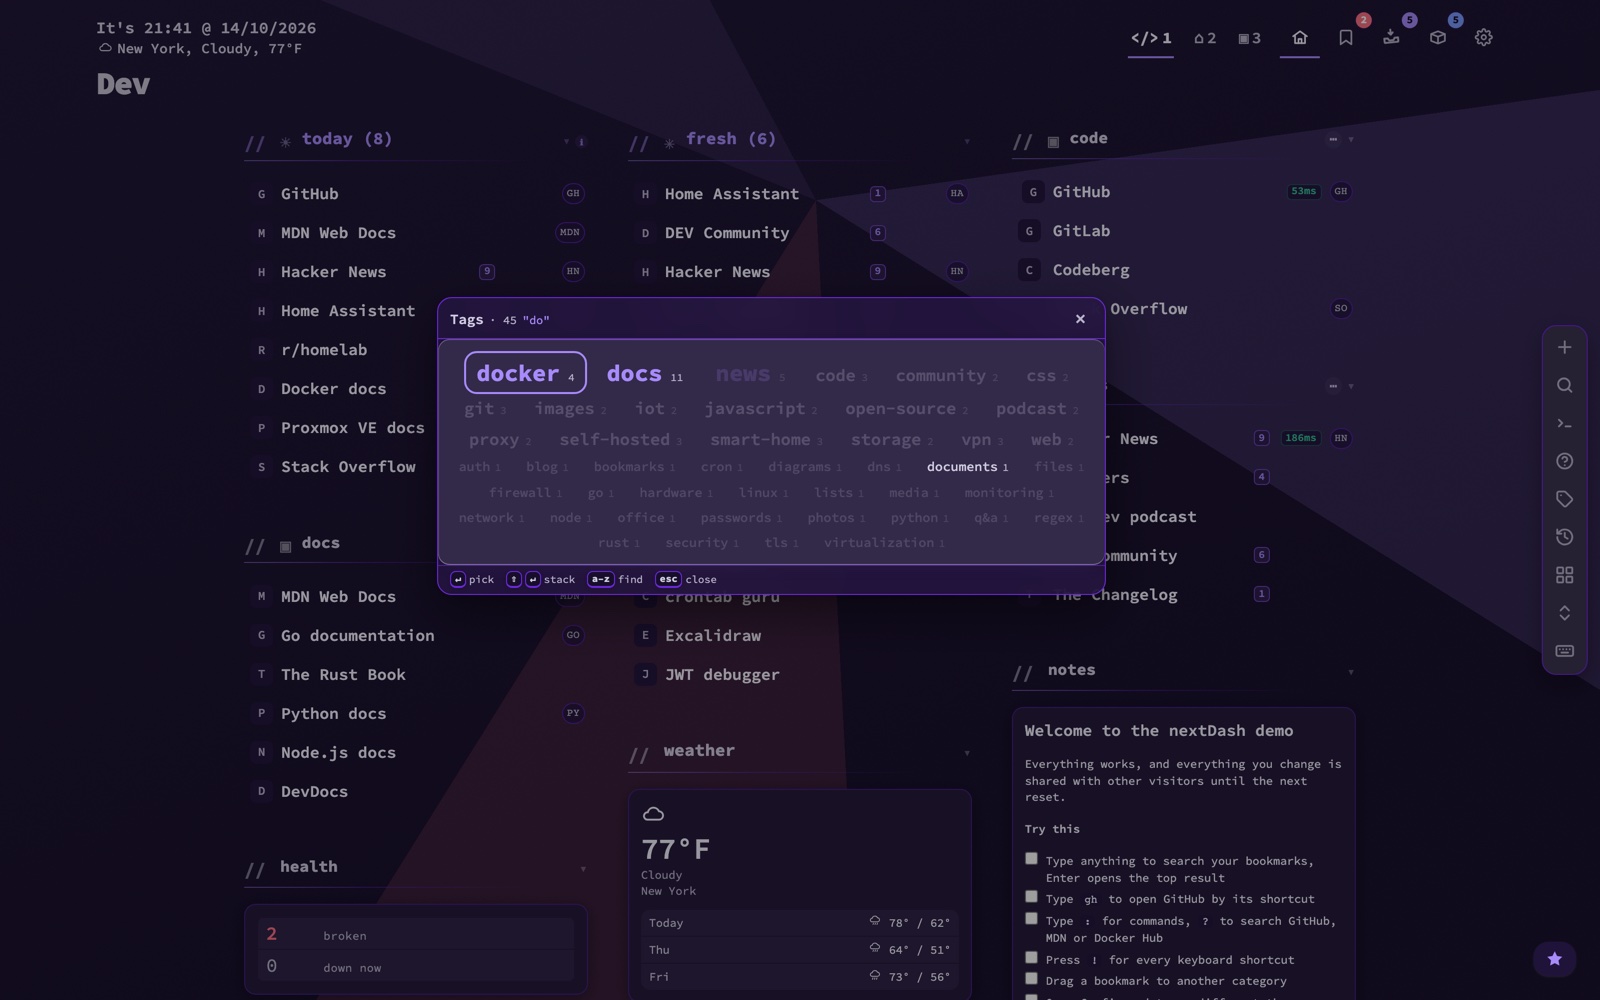
Shift+T opens a quick-tag popover. / opens the tag cloud: three sizes by use, each with its count, and you type to find a tag. Picking one opens the tag view, with every bookmark that carries it from every page, related tags, bulk actions, and rename, merge or remove for the tag itself; t opens it for a bookmark's own tag. nextDash also suggests tags, from a catalogue of some 51,000 sites and, for the rest, Wikidata: a dashed chip in the row, one click to add it, or Add all. Preview cards show who published a page and when, and for video providers they include a player you can start without leaving the dashboard.
Telling other programs, and letting them ask
Config -> Data & backups -> Webhooks pushes six events to a receiver: a bookmark added, changed or removed, a monitored bookmark going down or coming back, and a certificate about to expire. They are signed with the Standard Webhooks scheme, so a receiver that already verifies those needs no special case; a failed delivery is retried twice, and endpoints are checked at save time and again at delivery.
POST /your-endpoint
content-type: application/json
webhook-id: msg_2b7f...
webhook-timestamp: 1756253400
webhook-signature: v1,K5s0...
{"type":"bookmark.added","timestamp":"2026-08-27T09:30:00Z","data":{...}}
One MCP endpoint at POST /mcp lets an assistant search the collection, look one bookmark up, list the tags in use and add a bookmark. It is off until you switch it on, because it answers questions about every bookmark in the install - and adding a bookmark through it goes through the same handler the dashboard posts to, so duplicate checks and webhooks still apply.
Trust, data, and what it is not
$ Outgoing and trust: see it in action →
Your bookmarks are a map of what you care about. That map should live on your own disk - and the way a project handles that question tells you most of what you need to know about it.
Read this before you put it on the internet
nextDash is built for personal or small-team use on a trusted network. There are no user accounts. Do not expose nextDash directly to the public internet.
Private overlay network
Tailscale or another mesh VPN, so nextDash never gets a public listener at all.
Reverse proxy with auth
Traefik, Caddy or nginx, with basic auth, OAuth2 Proxy or SSO in front.
Local only
Bind to 127.0.0.1 and reach it over SSH port forwarding.
NEXTDASH_WRITE_TOKEN
Every destructive endpoint requires X-NextDash-Token. The dashboard injects it automatically in a browser.
NEXTDASH_CAPTURE_TOKEN
A phone's share sheet and a javascript: bookmark cannot set a header, so this weaker token opens capture and nothing else.
- The API answers this dashboard, not every page on the internet: cross-origin requests are refused unless you allow-list them.
- A stored sign-in stays on the service it was stored for, and a custom widget's address and key stay on the server.
- A webhook cannot be talked into delivering somewhere else, and outbound fetches are defended against SSRF at dial time, including DNS rebinding.
- The data directory is not browsable: it publishes icons and an uploaded favicon or font, and nothing else.
- A few requests go out by default, each with its own switch under Behavior -> Privacy & sync: an install count once a day (a random id and the version number), a daily check on GitHub for a newer release, and the nextdash.cc news feed. None of them carries bookmarks, settings or addresses. DISABLE_TELEMETRY, DISABLE_UPDATE_CHECK and DISABLE_NEWS_FEED turn them off for the whole server.
- Analytics are opt-in and off by default. When off, the tracker script is not even emitted into the page. When on, no bookmark names, URLs or search queries are sent, and every number is rounded into a band. DISABLE_TELEMETRY=true removes the choice server-wide.
Your data is a folder
There is no database. Your entire installation is a folder of JSON files you can read in a text editor, copy to a USB stick, or put in git.
data/
├── bookmarks-1.json    one file per page: the page, its categories, its bookmarks
├── settings.json       every setting, saved searches, collections, theme choice
├── colors.json         your custom themes
├── inbox.json          captured links waiting for triage
├── trash.json          deleted bookmarks, kept 30 days
├── health-history.json uptime samples - 30 days raw, 90 days of daily rollups
├── webhooks.json       endpoint URLs and signing keys, mode 0600
├── icons/              fetched and uploaded favicons, content-named
├── local-copies/       saved page snapshots
└── auto-backups/       rotating ZIPs, 3 by default (1-50)
A backup carries your whole data directory, so a restore does not lose your history. Two switches let you leave out the two largest or most sensitive things: local copies, and stored tokens. Exports exist for every part - bookmarks as CSV or browser-compatible HTML, inbox as CSV or JSON, health state and raw checks as CSV - and deleted bookmarks stay recoverable for thirty days in the Trash.
Is this for you?
You will probably love it if...
- You already self-host something - a NAS, a VPS, a Raspberry Pi, a Docker host.
- You reach for the keyboard first and resent tools that make you point at things.
- Your bookmarks number in the hundreds or thousands and you have lost track of them.
- You want a start page that is also a dashboard for your own services.
- You care that your reading list is not somebody else's dataset.
You should look elsewhere if...
- You need user accounts and permissions. There are none, by design.
- You want to expose it publicly. The README is blunt: do not.
- You want a read-later app or a feed reader. Local copies are a safety net, and Fresh counts new entries without showing them.
- You want a general automation platform. Webhooks and MCP tell other tools what changed - they are not a workflow engine.
- You want a hosted service with an app store listing and a support desk.
Start here
$ Page templates: see it in action →
I make nextDash for myself first: it is the start page on my own screen, and the one place I look to see whether my homelab is fine. If that sounds like something you would use, there are three ways in.
Try the live demo ↗
No install, no account. Change any setting you like; it resets to a fresh default every half hour.
two minutesInstall it →
One container, one folder, one port. No database, no migration, no account. The Quick Start in the README has the Docker Compose file.
unraidUse the Unraid template →
Search for nextDash in Community Applications, or read the template on GitHub.
The cheat sheet
Every shortcut, searchable in-app with ! or F1, and printable as a PDF from the repository. After an update, the What's new window gives the main change of a release a spotlight.
Standing on shoulders. nextDash is based on ThinkDashboard by MatiasDesuu, and released under the MIT licence. Written in Go with two dependencies, gorilla/mux and golang.org/x/net.